Working with query plan diagrams
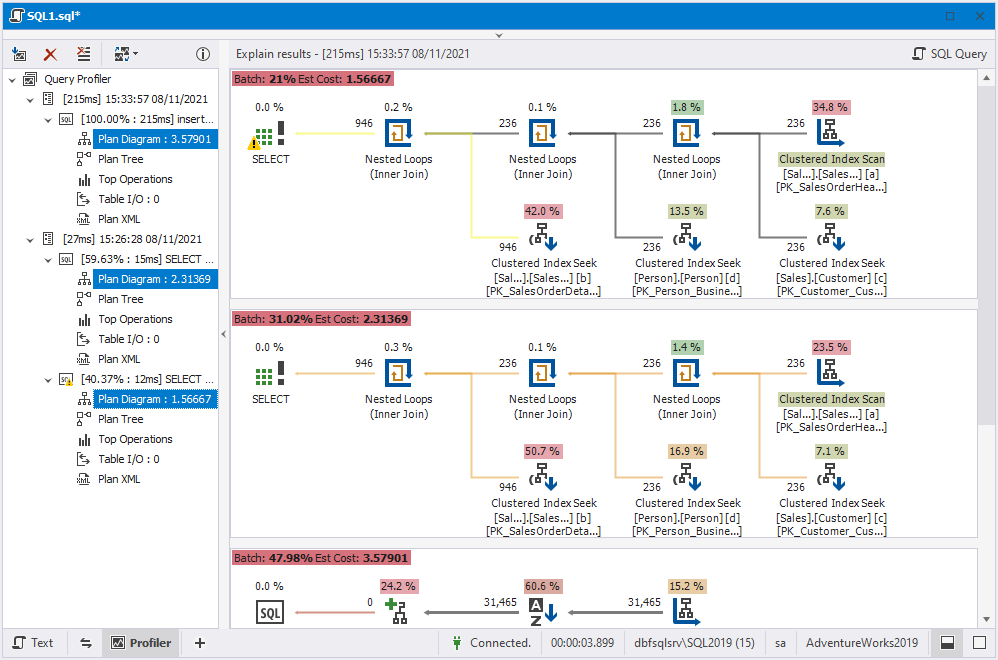
Query Profiler allows you to examine execution plans of different queries in a single view. The execution plan visually shows the estimated execution plan of a query and helps optimize SQL queries. To analyze multiple execution plans, hold the CTRL key and select several plan diagrams in the query profiling tree.
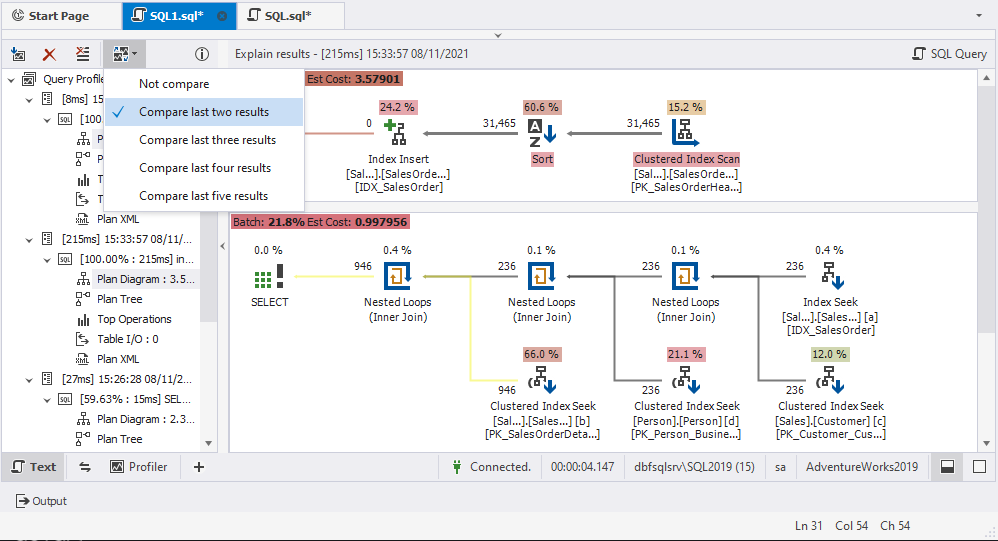
In the Query Profiler panel, you can set a number of plans to compare with the most recent result. For this, click ![]() and select a required option, for example, Compare last two results.
Then, modify a query and click
and select a required option, for example, Compare last two results.
Then, modify a query and click  Get New Results. The most recent result will be automatically compared with Plan #2. The comparison will not include Plan #1.
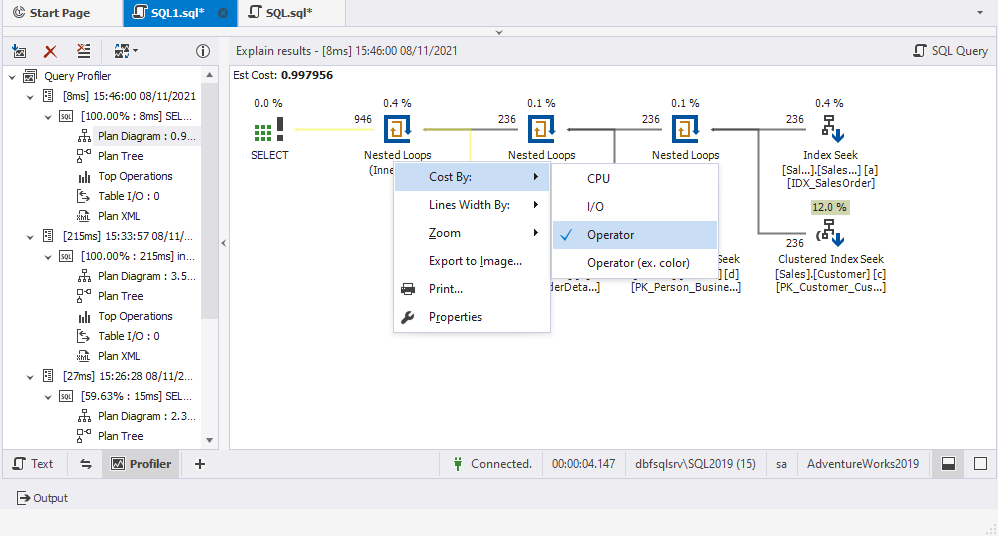
On the Plan Diagram, you can use the shortcut menu options to perform the following operations:
- Order the cost by CPU, I/O, Operator, and Operator excluding the color highlight.
- Arrange line width by rows or data size
- Zoom in and out a pan diagram
- Export to the image
- Print the diagram
- View the properties
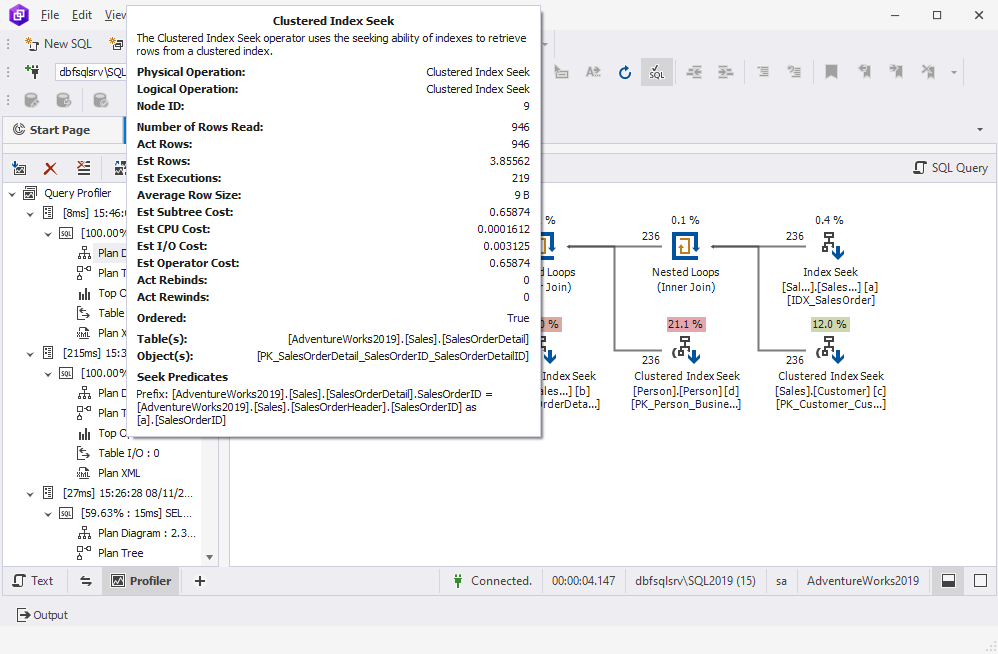
In addition, hover over the icon of the diagram element to view the information.