Query Profiling Mode
The Query Profiling Mode feature of dbForge Query Builder can be used to analyze and optimize SQL queries, as well as reduce the query execution time, ultimately improving the overall performance of their database applications. When comparing multiple queries, the tool collects and displays query profiling information with indicators highlighted in green for good performance and red for poor performance. Each time the query runs, Query Profiler saves the query plan enabling users to compare query performance before and after any optimization steps are applied.
The guide explains how to optimize SQL query performance using the Query Profiler tool.
For demo purposes, we will use two SELECT statements: the first one uses the LEFT JOIN operator, and the second one joins the tables based on a related column between them.
Both statements return the same result but with different time execution.
Profile a SQL query
1. On the standard toolbar, click New SQL and then click  Query Profiling Mode.
2. In a new SQL document that opens, enter the following scripts and click Execute (or press F5) to execute them:
SELECT b.brand_name, s.quantity, p.product_name, p.model_year, p.list_price
  FROM production.brands b
       LEFT JOIN production.products p   ON b.brand_id = p.brand_id
       LEFT JOIN production.stocks s  ON p.product_id = s.product_id
 WHERE p.product_name LIKE 'Electra%';


 SELECT (SELECT brand_name FROM production.brands b WHERE b.brand_id = p.brand_id) brand_name,
       s.quantity, p.product_name, p.model_year, p.list_price
  FROM production.products p, production.stocks s
 WHERE p.product_id = s.product_id AND p.product_name LIKE 'Electra%';
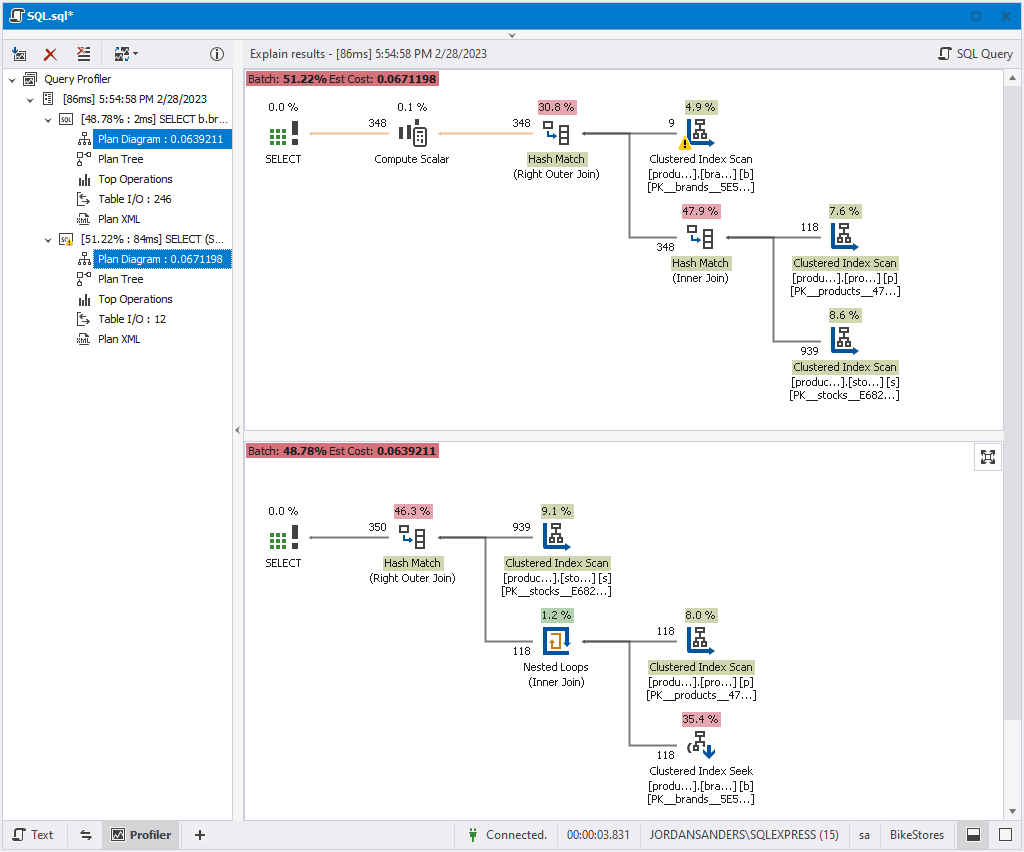
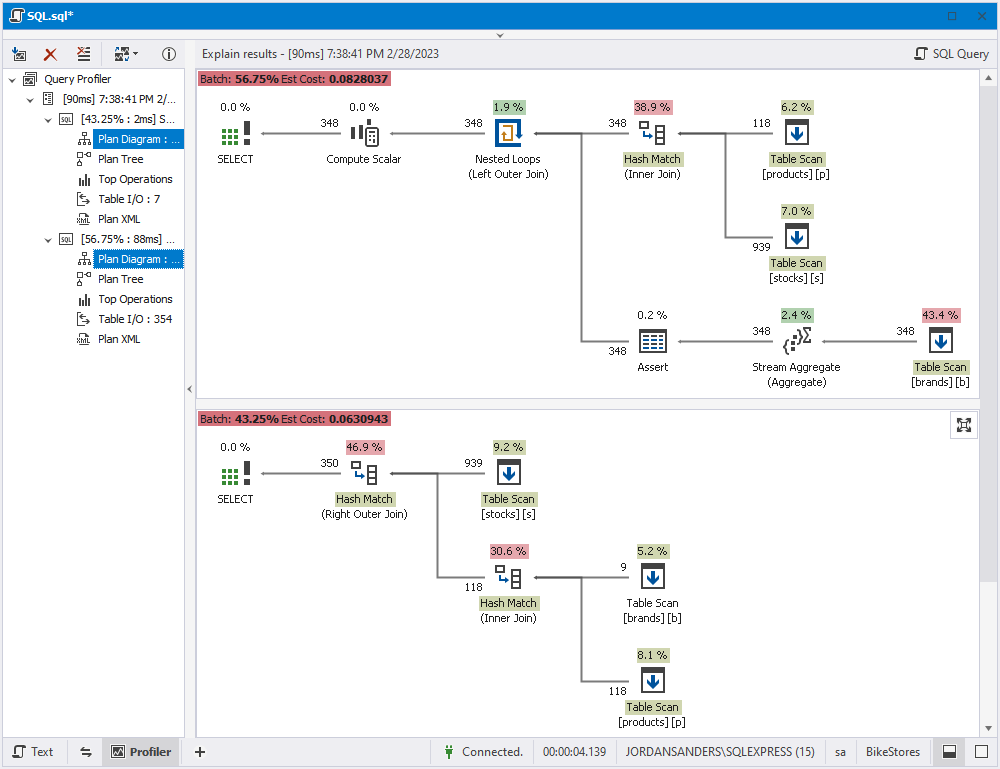
3. On the toolbar, click Execute or press F5. As you can see, the first query with the LEFT JOIN operator has been executed faster.
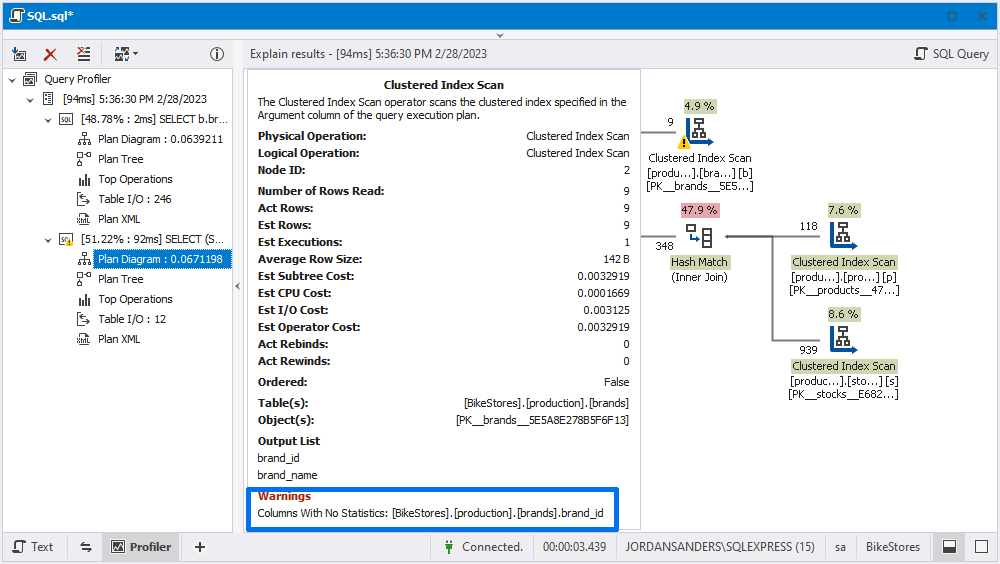
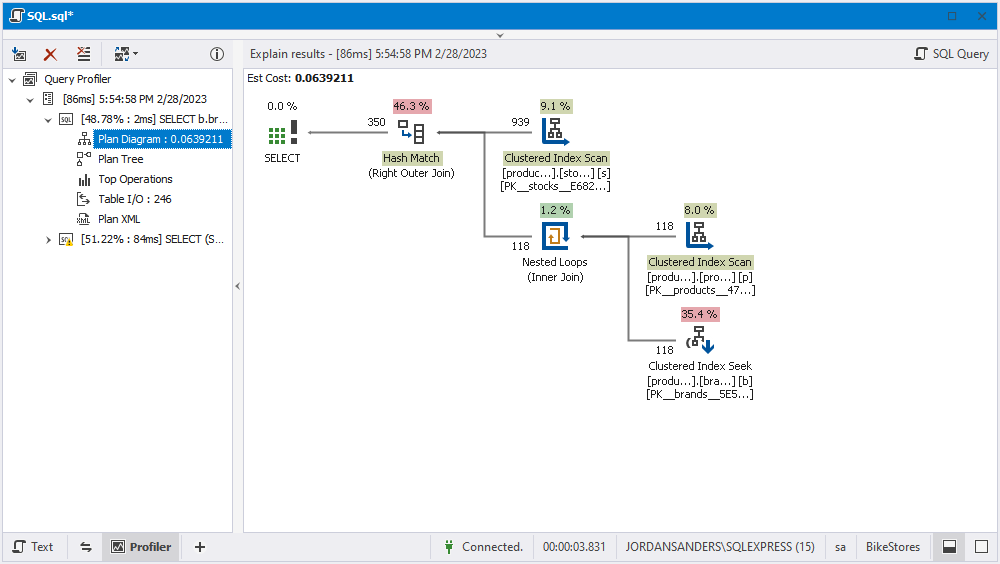
On the plan diagram of the second SELECT statement, there is a warning icon (exclamation mark) on the Clustered Index Scan. When you hover over the icon, a tooltip appears displaying the execution plan results and a warning message.
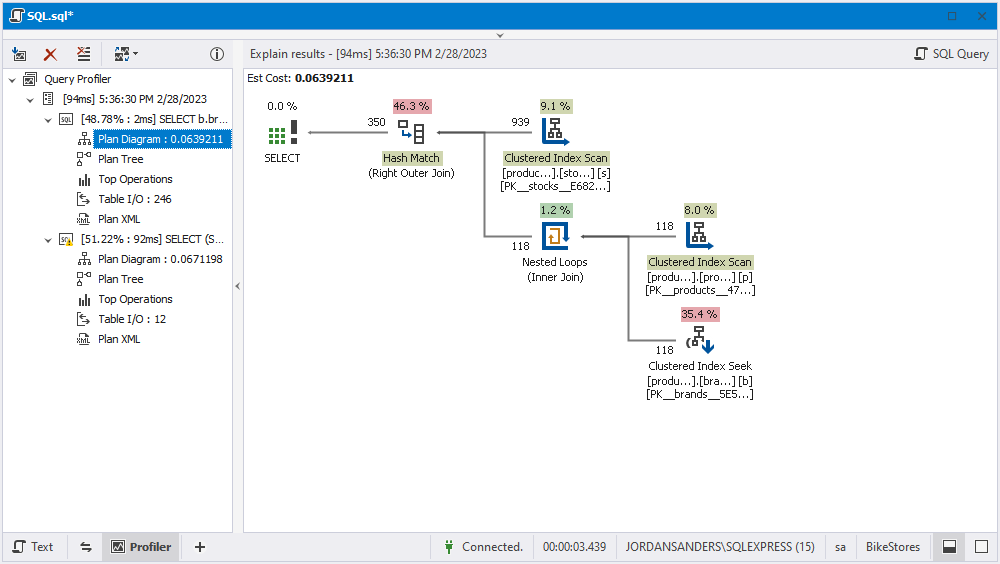
Whenever you receive profiling results for the executed query, a new node is displayed in the tree view with the query execution time and date.
To compare the profiling results, hold the CTRL key and select both plan diagrams.
In this example, we have selected data from the tables with indexes. However, if we delete indexes and rerun the statements, the execution time will increase and the plan diagram will change.
Query Profiler overview
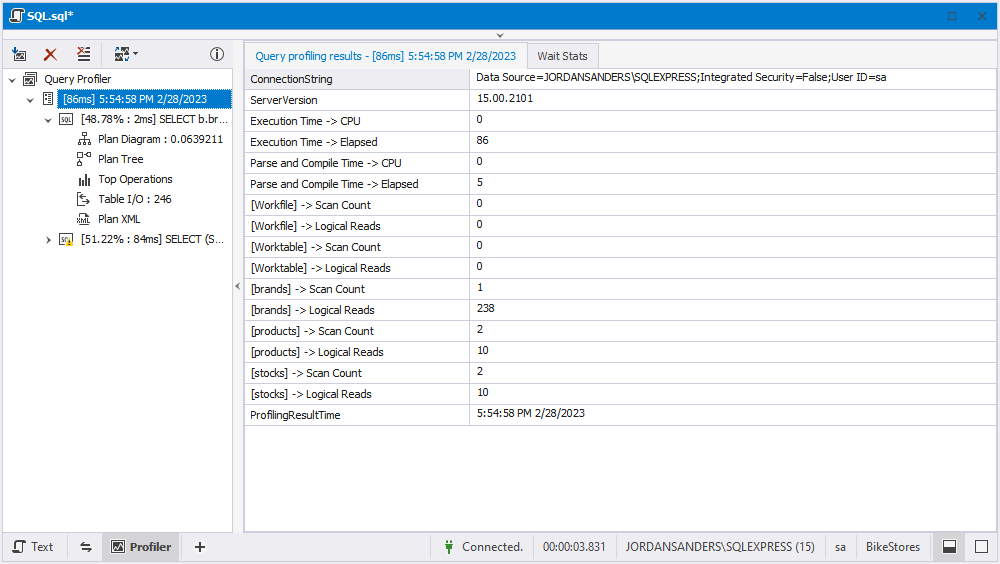
In the Query Profiler pane, you can see the following query profiling results:
- Common information about the query execution, including date and time required to execute the query.
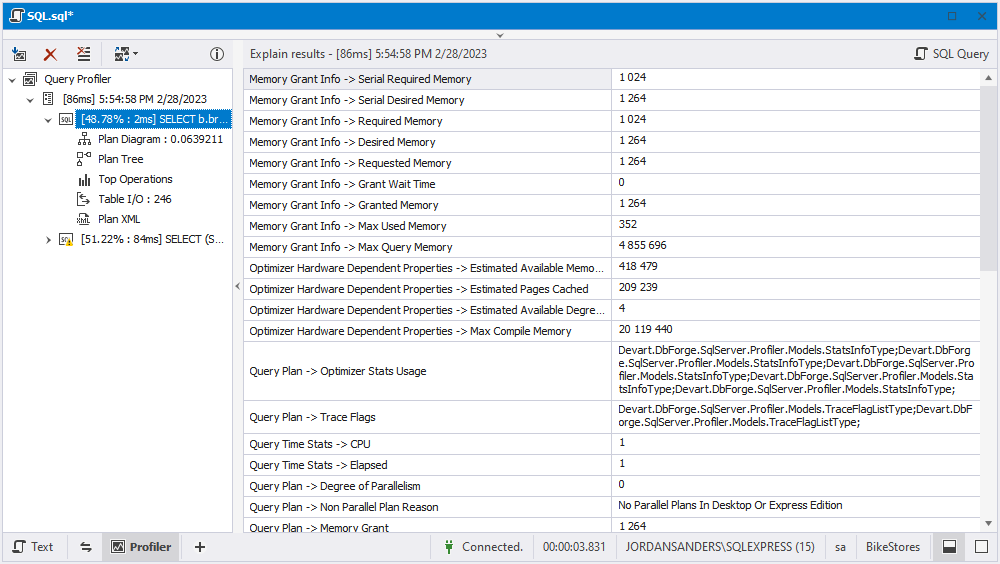
- Explain execution results of the query.
- Plan Diagram that displays the profiling results.
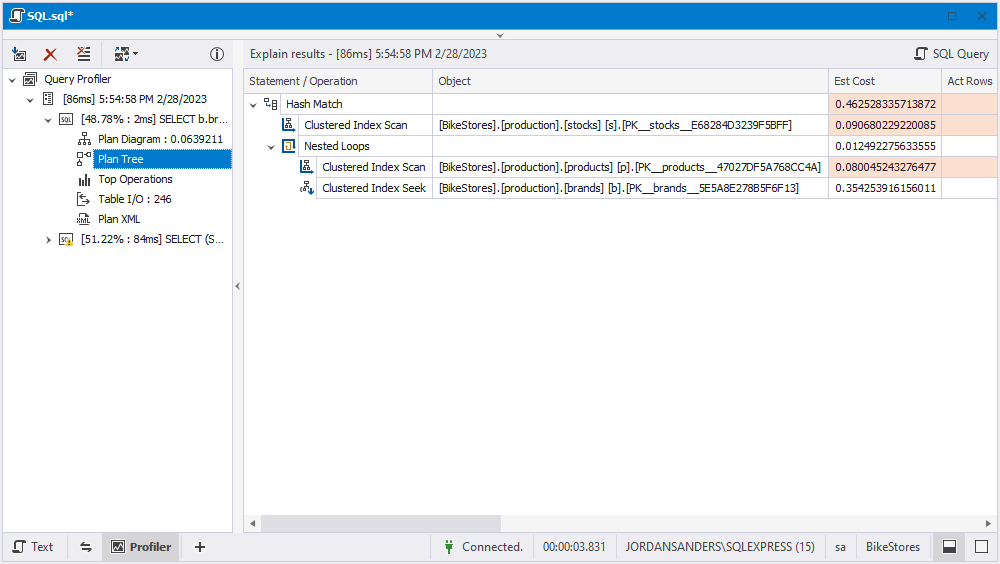
- Plan Tree that represents the hierarchical execution of the steps and objects that the query accesses.
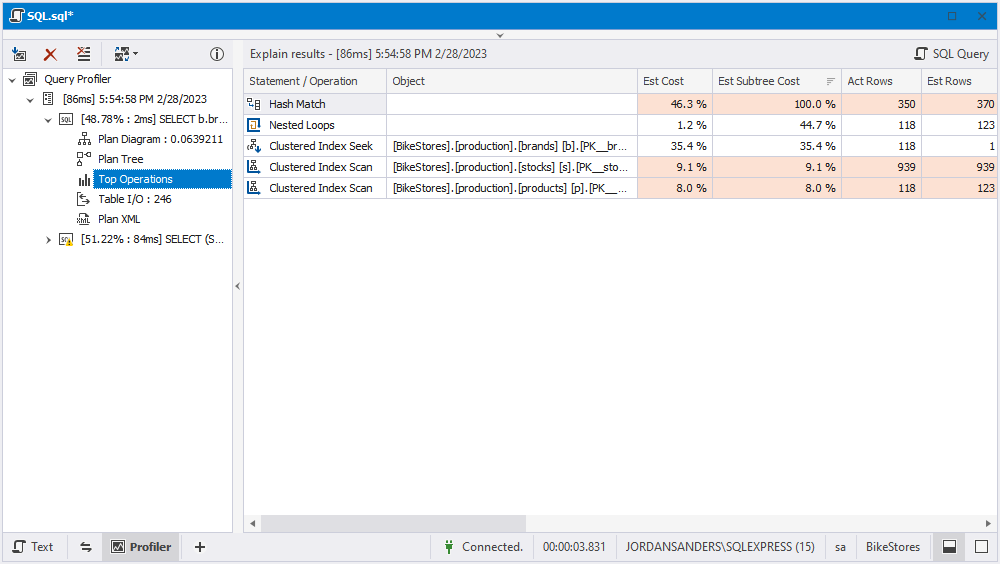
- A list of top operations that shows the most expensive operations.
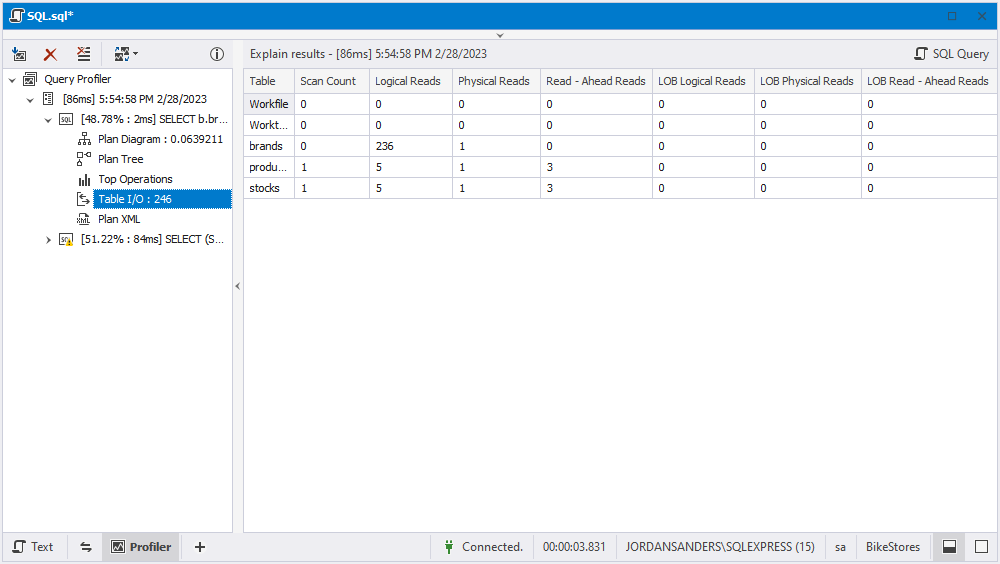
- Table input/output that provides the input-output statistics for all tables involved in the execution plan.
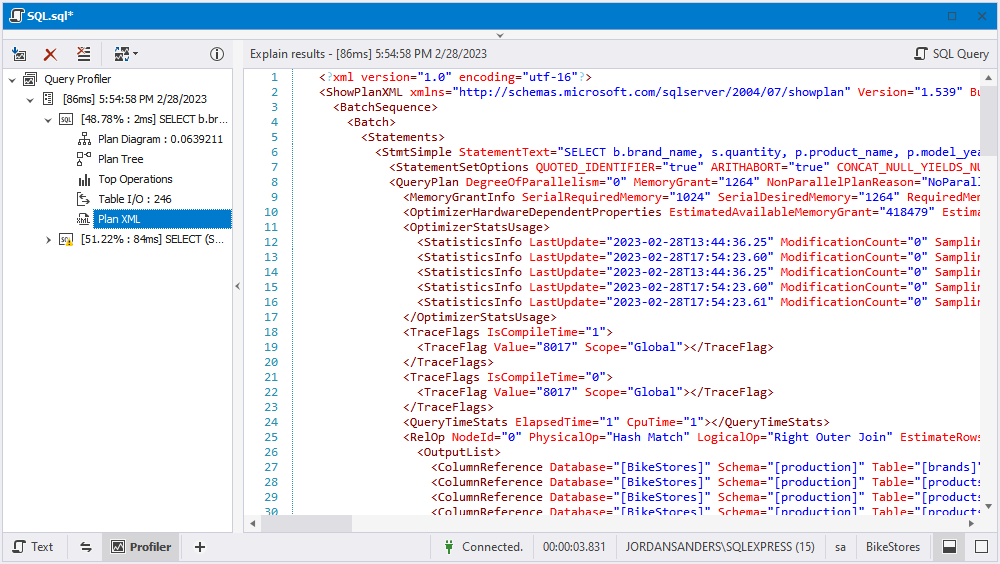
- Plan XML that represents the execution plan of their SQL queries in XML format for further analysis.