Debugging a Stored Procedure
This example demonstrates how to debug Microsoft SQL Server stored procedure by stepping into the stored procedure. It also illustrates different debugging techniques such as setting breakpoints, viewing data items, and so on.
Creating a Sample Procedure
In this topic, some sample database objects are used for demonstrating how to work with the dbForge Fusion for SQL Server Debugger. Use scripts specified in this topic to create necessary objects in your test database.
Database Procedure
Use the script below to create the procedure that takes two input parameters: DateFrom and DateTo. Based on these input parameters the table fills up with data.
Debugging the Stored Procedure
Assume that you need to get Time Sheet for a specific time period. To do this, execute the FillSchedule procedure:
- In Database Explorer, choose your test database.
- Click Procedures and then right-click the FillSchedule procedure, and click Execute on the shortcut menu.
-
Enter input parameters.
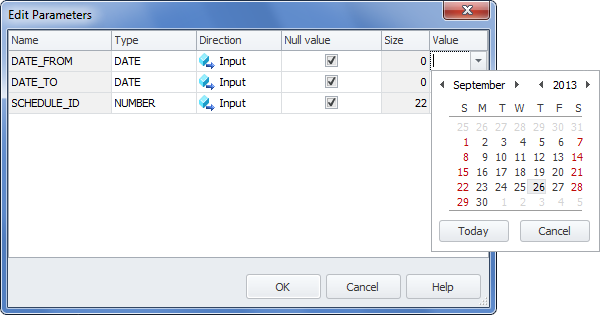
- Click OK.
Note
Actual document look may slightly vary from the above image depending on the product you use.
A quick look through the code gives you nothing and you have no other choice but to start the debugger.
Debugging Procedure
To start debugging the stored procedure:
- To compile the stored procedure for debugging, navigate to the required procedure in Database Explorer, select Compile, and then click Compile Dependants for Debugging on the shortcut menu.
- Click the Start Debugging button on the Devart - Debug toolbar.
- If you have not compiled the procedure, the dbForge Fusion for SQL Server prompts you to compile it. Click Yes.
-
Enter the stored procedure input parameters once again and click OK.
You can see that the yellow arrow identifies the stack frame where the execution pointer is currently located.
- To stop the debugging process, click the Stop button.
- Click Execute to run the stored procedure.
- You can see the message telling us that the stored procedure executed successfully. To verify this, you can retrieve the data from the table.
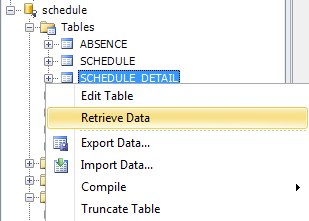
- In Database Explorer, choose the required database.
- Click Tables and then right-click the required table.
-
Click Retrieve Data on the shortcut menu.
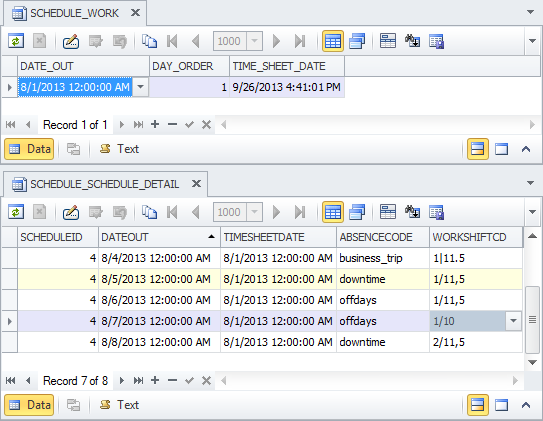
-
dbForge Fusion for SQL Server displays the result table.
As you see, the Debugger for Microsoft SQL Server is a very simple and powerful tool to use. You can use different debugging techniques to achieve successful results.