


Comparing Query Profiling Results
Last modified: June 26, 2023
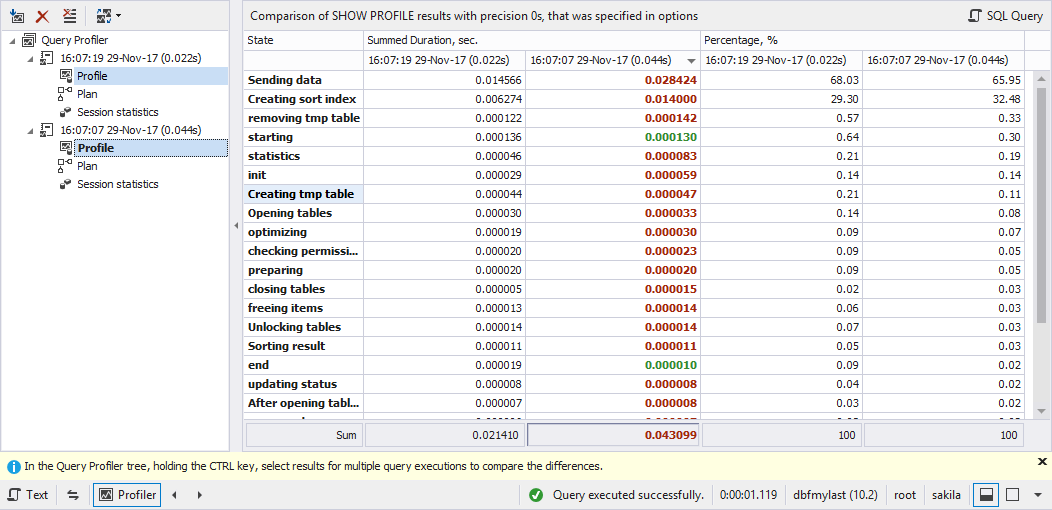
Each time you get profiling results for the executed query, they appear in the tree view as a new node with time and date of query execution. When editing your query, you want to know whether your changes reduce query execution time or not. Query Profiler can quickly compare the profiling results. Do the following:
- Select the nodes of the required query profiling results in the tree view by holding the CTRL key.
- Click the
 Compare Selected Results button on the toolbar or select the corresponding option on the shortcut menu. The compared results appear in the grid where differences are highlighted.
Was this page helpful?'%3e%3cpath%20id='thumb_up_2'%20d='M15%2017H5.5V7L11.5%201L12.1667%201.45833C12.4028%201.625%2012.5833%201.83681%2012.7083%202.09375C12.8333%202.35069%2012.8681%202.61806%2012.8125%202.89583L12.7917%203L12%207H17.5C17.9167%207%2018.2708%207.14583%2018.5625%207.4375C18.8542%207.72917%2019%208.08333%2019%208.5V9.6875C19%209.79861%2018.9896%209.89931%2018.9688%209.98958C18.9479%2010.0799%2018.9167%2010.1736%2018.875%2010.2708L16.3944%2016.0875C16.2703%2016.3625%2016.0833%2016.5833%2015.8333%2016.75C15.5833%2016.9167%2015.3056%2017%2015%2017ZM7%2015.5H15L17.5%209.6875V8.5H10.1667L11.1875%203.4375L7%207.625V15.5ZM5.5%207V8.5H2.5V15.5H5.5V17H1V7H5.5Z'%20fill='%2327282C'/%3e%3c/g%3e%3c/g%3e%3c/svg%3e) Yes
Yes'%3e%3cpath%20id='thumb_down_2'%20d='M5%203H14.5V13L8.5%2019L7.83333%2018.5417C7.59722%2018.375%207.41667%2018.1632%207.29167%2017.9062C7.16667%2017.6493%207.13194%2017.3819%207.1875%2017.1042L7.20833%2017L8%2013H2.5C2.08333%2013%201.72917%2012.8542%201.4375%2012.5625C1.14583%2012.2708%201%2011.9167%201%2011.5V10.3125C1%2010.2014%201.01042%2010.1007%201.03125%2010.0104C1.05208%209.92014%201.08333%209.82639%201.125%209.72917L3.60417%203.91667C3.71528%203.63889%203.89931%203.41667%204.15625%203.25C4.41319%203.08333%204.69444%203%205%203ZM13%204.5H5L2.5%2010.3125V11.5H9.83333L8.8125%2016.5625L13%2012.375V4.5ZM14.5%2013V11.5H17.5V4.5H14.5V3H19V13H14.5Z'%20fill='%2327282C'/%3e%3c/g%3e%3c/g%3e%3c/svg%3e) No
No
YesNo
