Query Profiler overview
dbForge Studio provides Query Profiler is a query examining and troubleshooting tool to analyze and optimize SQL Server queries. It enables you to collect and review performance data for executed statements and identify issues, such as long-running queries, excessive I/O, or inefficient indexing.
Query Profiler displays execution statistics, such as query duration, CPU time, logical reads, and the number of affected rows. It also provides access to execution plans that show how the SQL Server query optimizer interprets and executes your statements.
Query Profiler enables you to:
- Identify and troubleshoot performance bottlenecks.
- Compare query behavior before and after changes.
- Analyze execution plans to understand query flow.
- Validate the effectiveness of indexes or query rewrites.
Query Profiler results
Query Profiler outputs query profiling results as a Query Profiler navigation tree with the following panes:
- Common information – General details about the query execution, including wait statistics.
- Explain results – Performance-related data and execution analysis.
- Plan Diagram – A visual representation of logical and physical query operations.
- Plan Tree – A hierarchical view of execution steps, costs, and row estimates.
- Top Operations – The most resource-intensive operations by CPU, I/O, or memory.
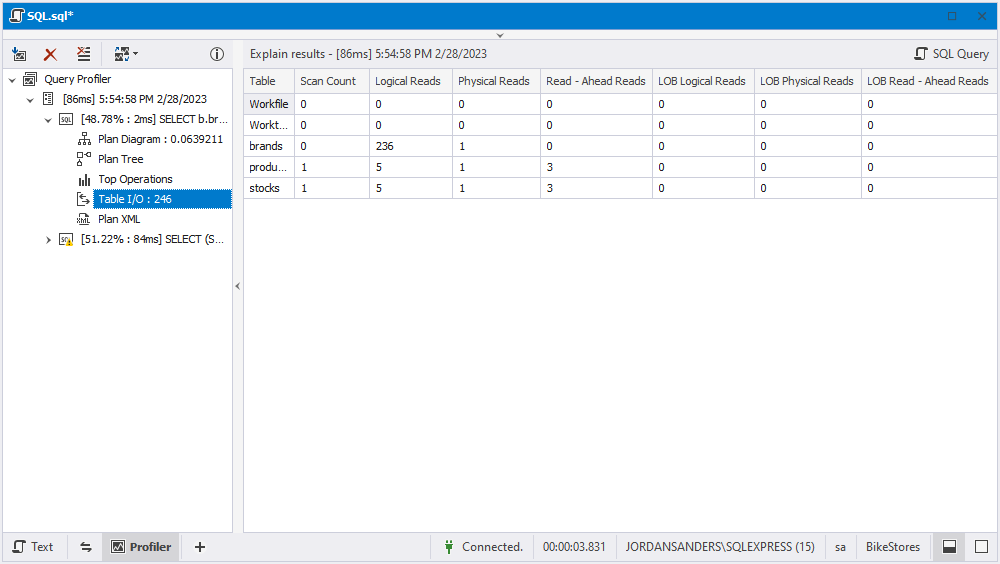
- Table I/O – Logical and physical reads and writes per table.
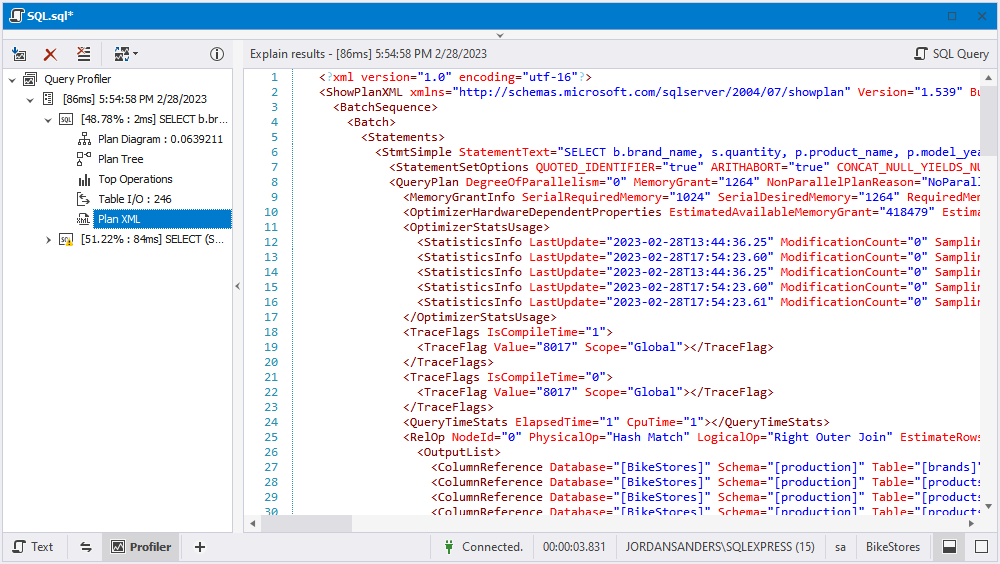
- Plan XML – The raw execution plan in XML format for detailed inspection.
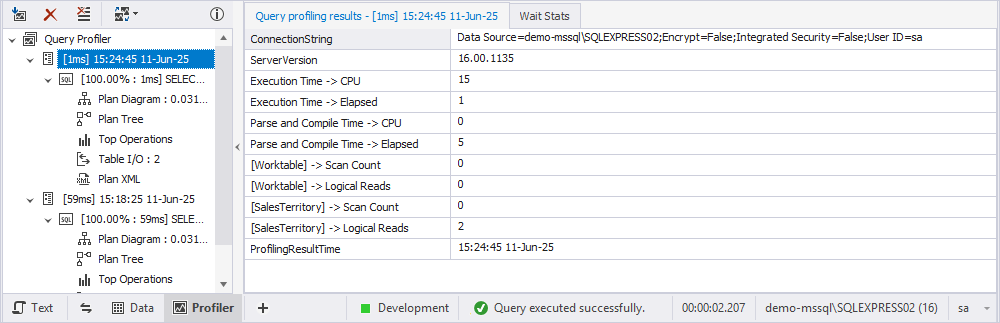
Common information
This section provides common information about the query execution, including the date and time required to execute the query. It consists of the Query profiling results and Wait Stats tabs.
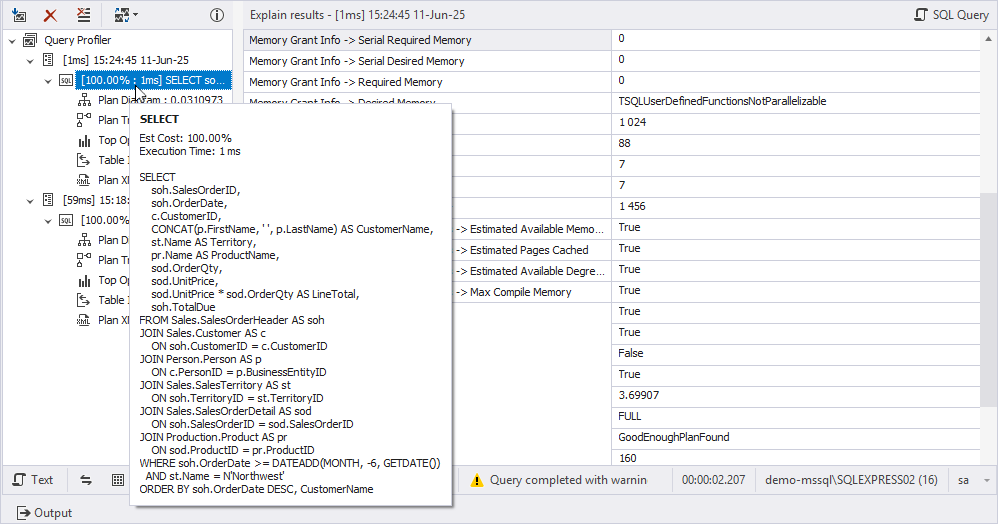
Explain results
This section contains detailed analysis and performance-related data about how the SQL Server optimizer plans to execute or has already executed a query.
Tip
Hovering over the section in the navigation tree shows the body of the query.
Plan Diagram
This section provides a visual representation of the logical and physical operations to execute the query, including scans, JOINs, or sorts.

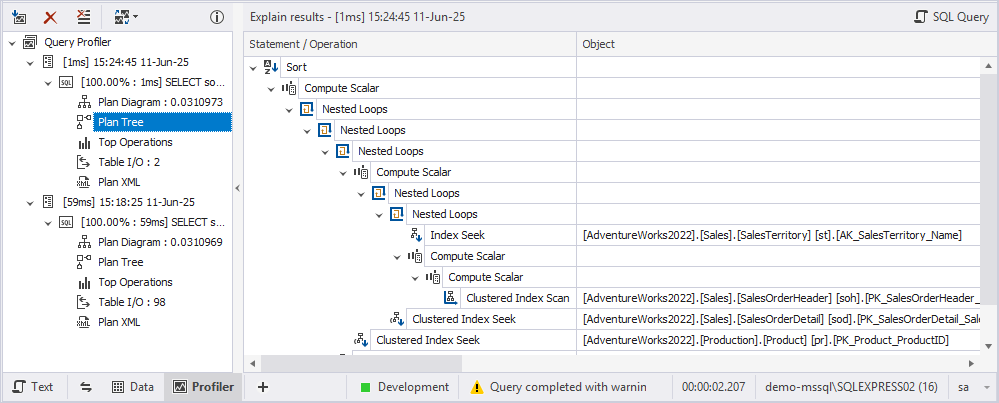
Plan Tree
This section represents the hierarchical, step-by-step view of each operation in the execution plan, including cost, estimated rows, and execution order.
Top Operations
This section shows most resource-intensive operations, including CPU, I/O, and memory usage.
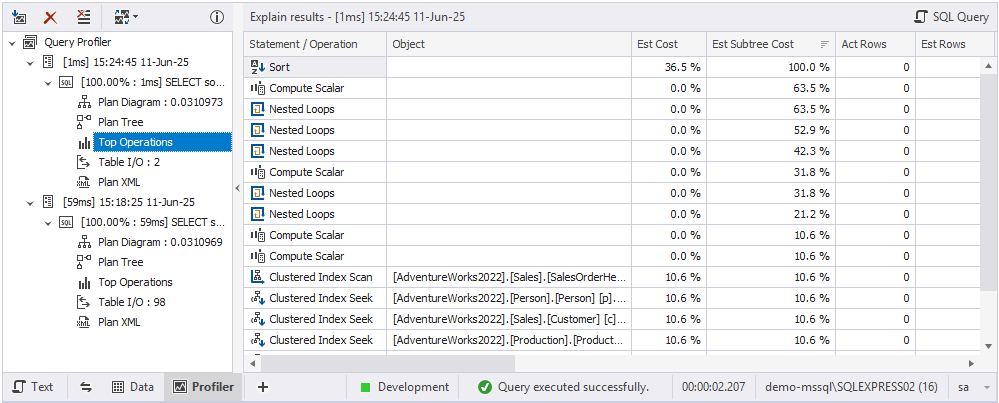
Table I/O
This section shows the number of logical and physical reads and writes per table in the execution plan to help identify performance bottlenecks.
Plan XML
This section displays the execution plan in XML format for detailed inspection and analysis.
Query Profiler toolbar
The Query Profiler toolbar appears at the top of the Query Profiler document.

The table describes the available options.
| Icon | Name | Description |
|---|---|---|
| Get New Results | Re-executes a query after making changes to get new results. | |
| Remove Results | Clears or deletes the previously captured query profiling results from the results pane. | |
| Clear History | Permanently deletes the record of all previously captured profiling sessions from the profiler’s session history. | |
| Compare Results | Sets the autoselection of the non-batch query profiling results for comparison. The automatic selection always works for batch queries and is equal to 100 (maximum) profiling results. The available options are:
|
Switch between document views
At the bottom of the Query Profiler window, you can switch between document views using the Move between document views toolbar.

The table describes the available document views.
| Name | Description |
|---|---|
| Text | Opens the executed query in SQL Editor for editing. |
| Data | Opens Data Editor to view and edit the result set. |
| Profiler | Opens the Query Profiler document to analyze query performance. This view is selected by default. |
| Query Builder | Opens the Query Builder document with the generated query displayed in both the diagram and Tabbed Editor. |
| Pivot Table | Opens the Pivot Table view, where you can create a pivot table based on the executed query. |
Swap main and additional document views
To switch the context between the main and additional views without closing or re-splitting the document, click ![]() .
.
To open the menu where you can choose which additional view to move, click ![]() .
.
Hide document views
To hide a document view, select the required view, click ![]() , then select Hide.
, then select Hide.
Show all document views
To show all document views, click ![]() , then select Show All Views.
, then select Show All Views.
Show SQL query viewer
To view the executed query for the selected execution plan, in the upper-right corner of the Query Profiler document, select SQL Query.
The SQL query viewer appears below the Query Profiler area.