Improve query performance
The Query Profiler, AI Assistant, and T-SQL Code Analyzer tools in dbForge Studio for SQL Server help you improve SQL query performance. This topic describes effective techniques for improving query performance and provides practical examples.
Note
Query performance may vary even when you use the same schemas and similar test data. To ensure accurate results, measure query performance in both development and production environments.
Use JOINs instead of subqueries
Using JOINs instead of subqueries is a common technique for improving performance. JOINs enable SQL Server to retrieve related data more efficiently by using indexed relationships between tables. This can significantly speed up query processing and improve execution times, especially when compared to nested queries. You can use Query Profiler to measure query performance and compare the execution times of different queries.
To compare the execution time of different queries:
1. On the toolbar, select New SQL, then click Query Profiling.
2. In the SQL document, enter your query.
3. Click Execute.
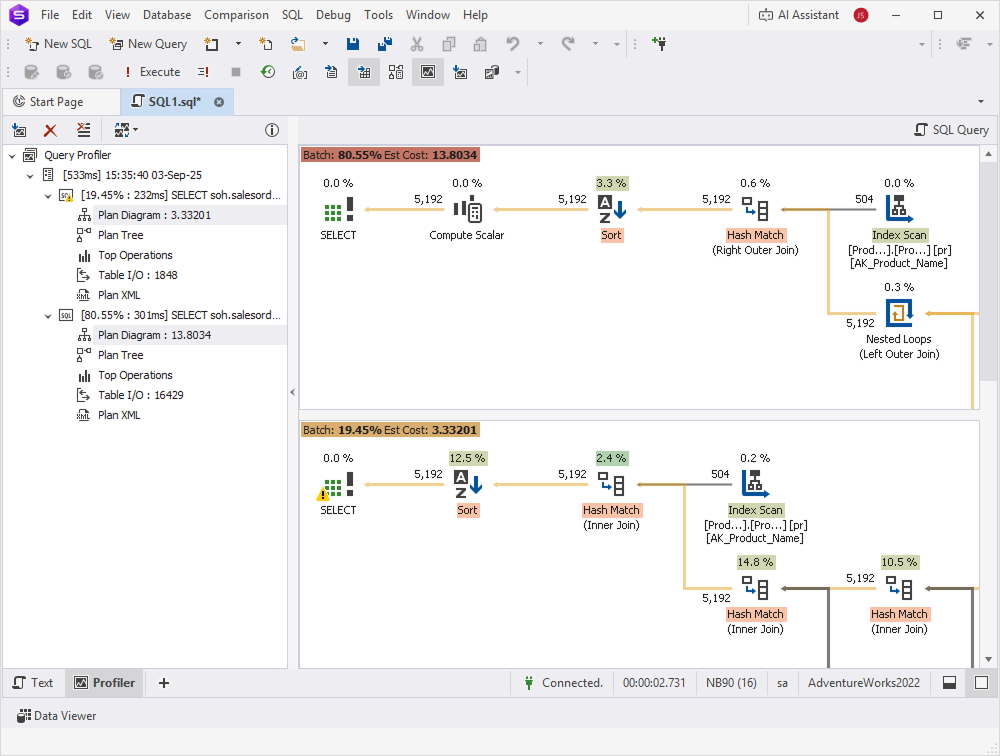
The following examples show how query performance can differ between a JOIN and a subquery.
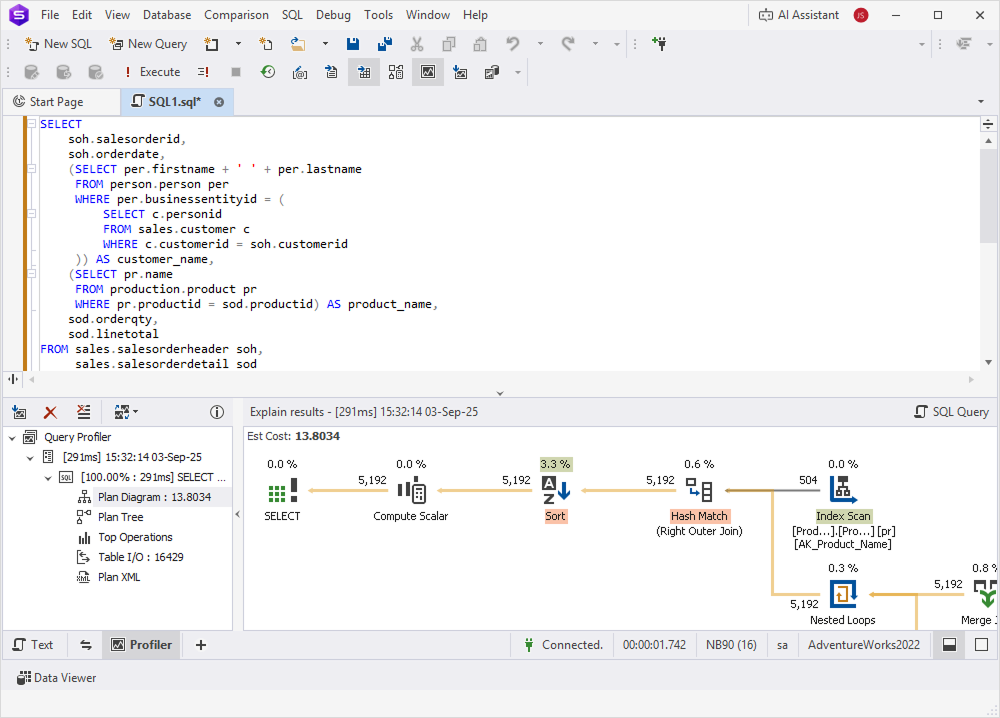
Example of a query with a subquery
SELECT
    Soh.SalesOrderId,
    Soh.OrderDate,
    (SELECT Per.FirstName + ' ' + Per.LastName
     FROM Person.Person Per
     WHERE Per.BusinessEntityId = (
         SELECT C.PersonId
         FROM Sales.Customer C
         WHERE C.CustomerId = Soh.CustomerId
     )) AS CustomerName,
    (SELECT Pr.Name
     FROM Production.Product Pr
     WHERE Pr.ProductId = Sod.ProductId) AS ProductName,
    Sod.OrderQty,
    Sod.LineTotal
FROM Sales.SalesOrderHeader Soh,
     Sales.SalesOrderDetail Sod
WHERE Soh.SalesOrderId = Sod.SalesOrderId
  AND Soh.OrderDate BETWEEN '2013-01-01' AND '2013-12-31'
  AND Sod.OrderQty > 5
ORDER BY Soh.SalesOrderId, ProductName;
Example of an equivalent query using a JOIN
SELECT
    Soh.SalesOrderId,
    Soh.OrderDate,
    Per.FirstName + ' ' + Per.LastName AS Customer_Name,
    Pr.Name AS Product_Name,
    Sod.OrderQty,
    Sod.LineTotal
FROM Sales.SalesOrderHeader Soh
INNER JOIN Sales.SalesOrderDetail Sod
    ON Soh.SalesOrderId = Sod.SalesOrderId
INNER JOIN Production.Product Pr
    ON Sod.ProductId = Pr.ProductId
INNER JOIN Sales.Customer C
    ON Soh.CustomerId = C.CustomerId
INNER JOIN Person.Person Per
    ON C.PersonId = Per.BusinessEntityId
WHERE Soh.OrderDate BETWEEN '2013-01-01' AND '2013-12-31'
  AND Sod.OrderQty > 5
ORDER BY Soh.SalesOrderId, Product_Name;
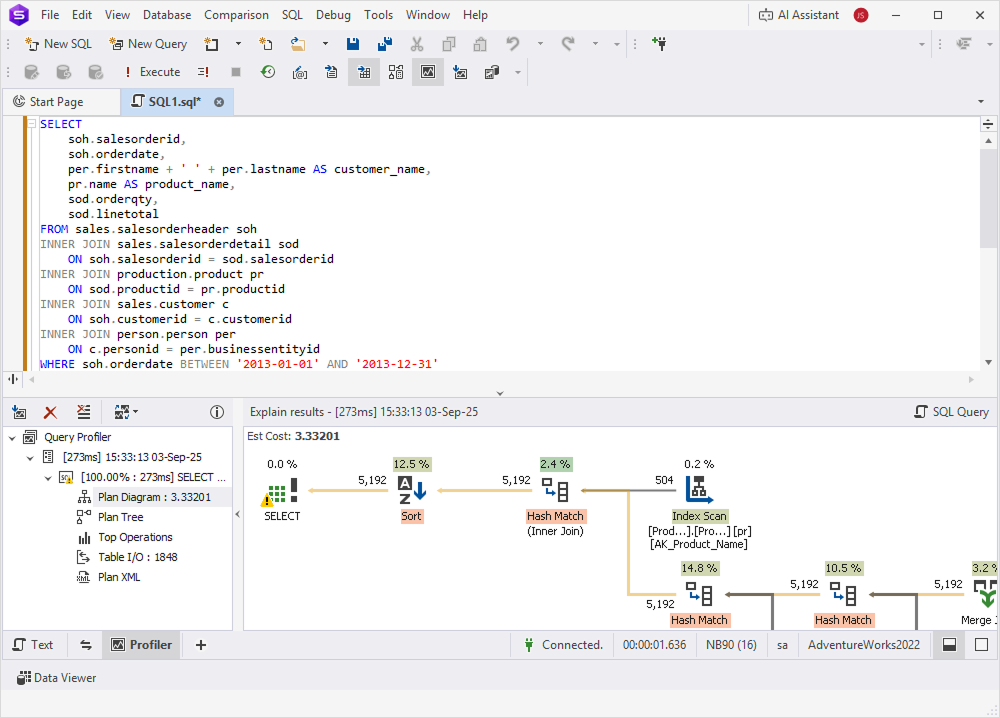
The results show that the JOIN query is more efficient than the one using a subquery.
Apply data filtering instead of using functions
Filtering data with actual values, instead of applying functions to columns, improves SQL query performance. When a function is applied directly to a column (for example, WHERE YEAR(date_column) = 2023), SQL Server cannot use indexes efficiently. This often leads to full table or index scans, which can significantly slow down query execution.
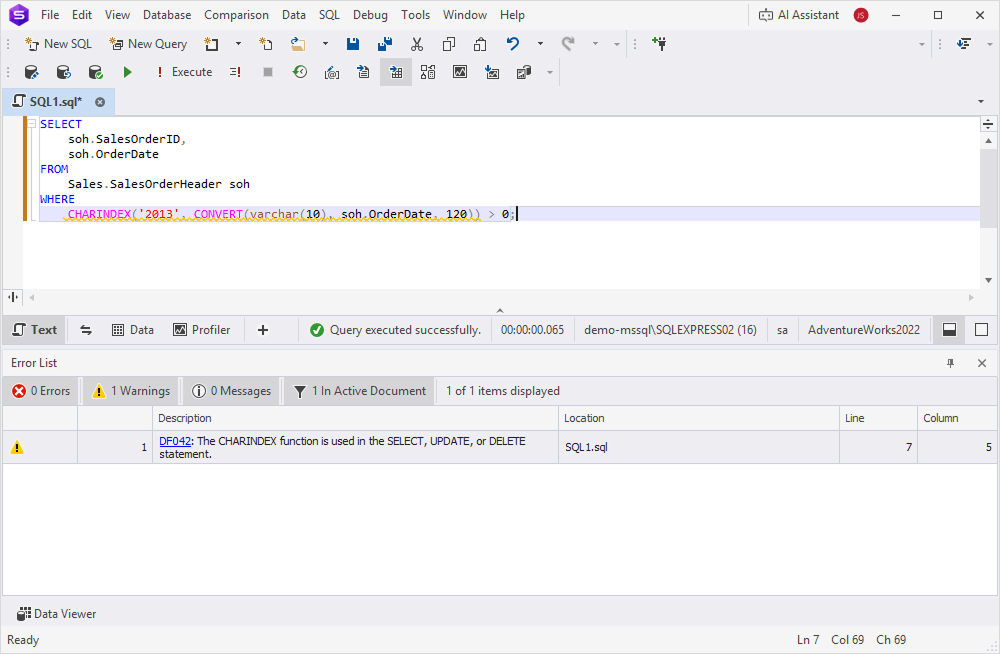
In the following examples, we use T-SQL Code Analyzer to identify potential performance issues. Then, we compare the efficiency of two queries: one that applies a function to a column and another that filters data without using functions.
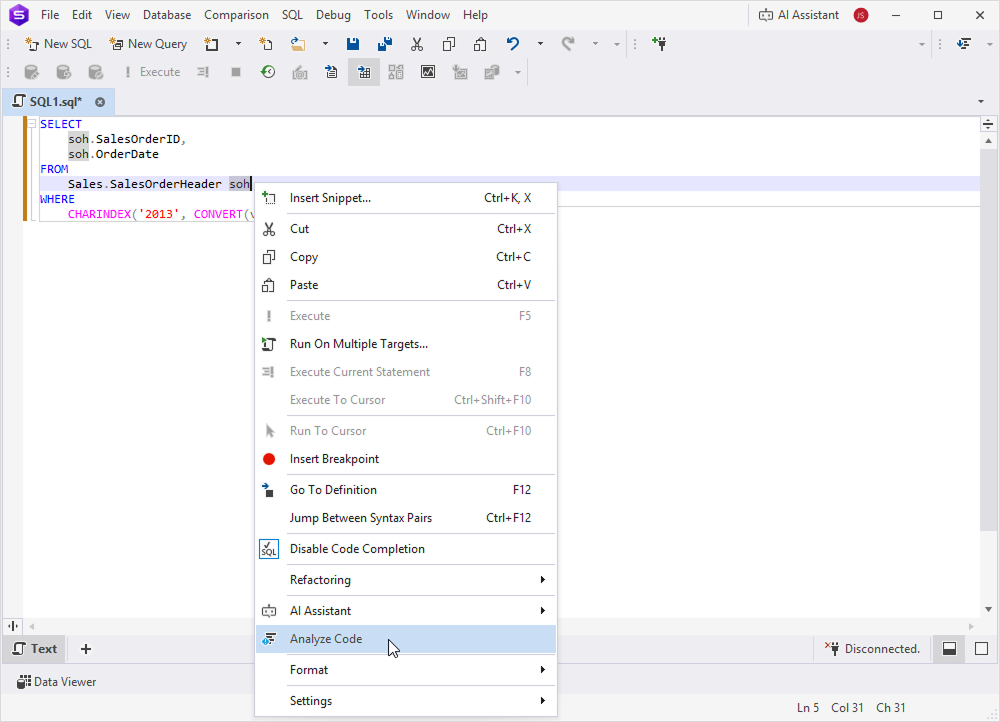
Step 1: Analyze a query using T-SQL Code Analyzer
1. On the toolbar, select New SQL to open a new SQL document.
2. Enter the query you want to analyze.
3. Right-click in the editor and select Analyze Code.
The results appear in the Output window or the Error List pane.
Example of a query with a function
SELECT
    soh.SalesOrderID,
    soh.OrderDate
FROM
    Sales.SalesOrderHeader soh
WHERE
    CHARINDEX('2013', CONVERT(varchar(10), soh.OrderDate, 120)) > 0;
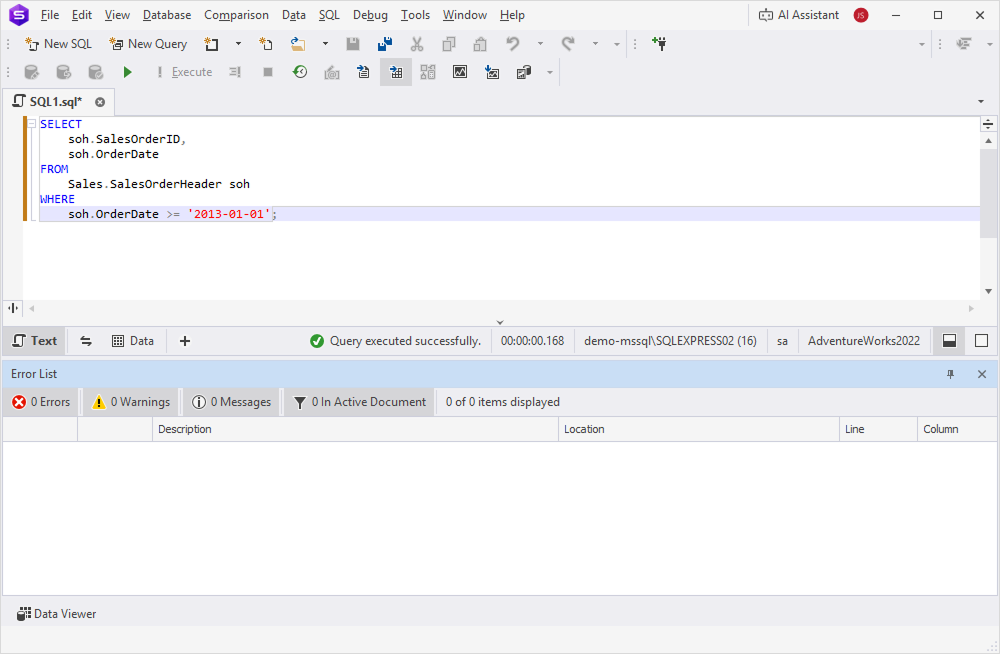
Example of a query with data filtering
SELECT
    soh.SalesOrderID,
    soh.OrderDate
FROM
    Sales.SalesOrderHeader soh
WHERE
    soh.OrderDate >= '2013-01-01';
Step 2: Compare query efficiency
1. On the toolbar, select New SQL, then click Query Profiling.
2. In the SQL document, enter both queries.
3. Click Execute.
Add an index to data filtering queries
Creating an index on a filtered column improves query performance by enabling SQL Server to quickly locate matching rows, rather than scanning the entire table. You can use Query Profiler to measure the performance impact of indexing.
To measure the performance impact of indexing:
1. On the toolbar, select New SQL, then click Query Profiling.
2. In the new SQL document, enter your query.
3. Click Execute to run the query and view performance metrics.
The following examples compare a query that filters by a column with the same query that uses an index.
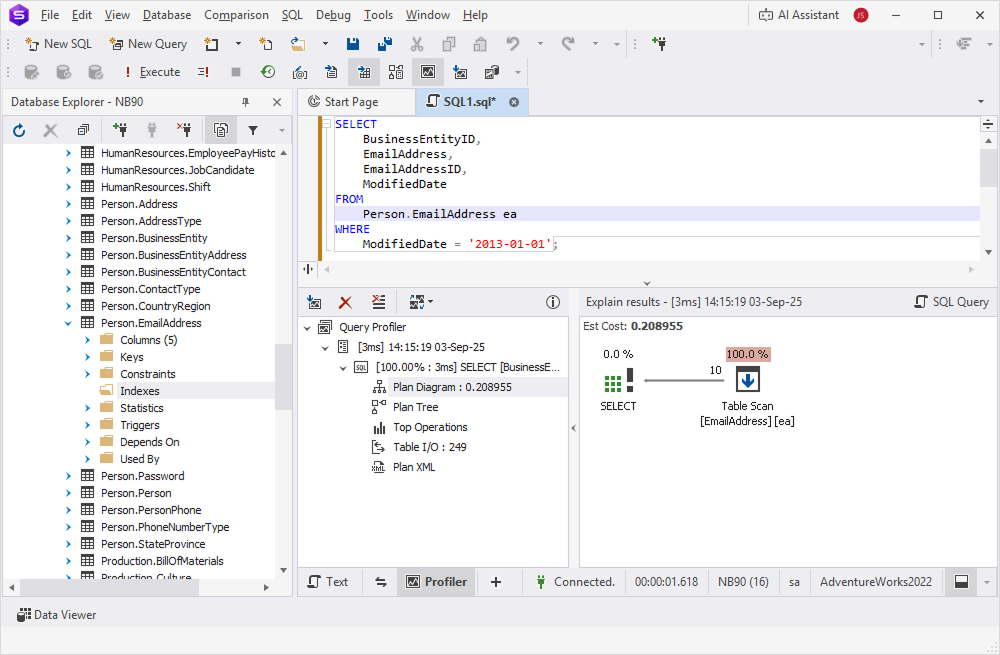
Example of a query with column filtering
SELECT
    BusinessEntityID,
    EmailAddress,
    EmailAddressID,
    ModifiedDate
FROM
    Person.EmailAddress
WHERE
    ModifiedDate = '2013-01-01';
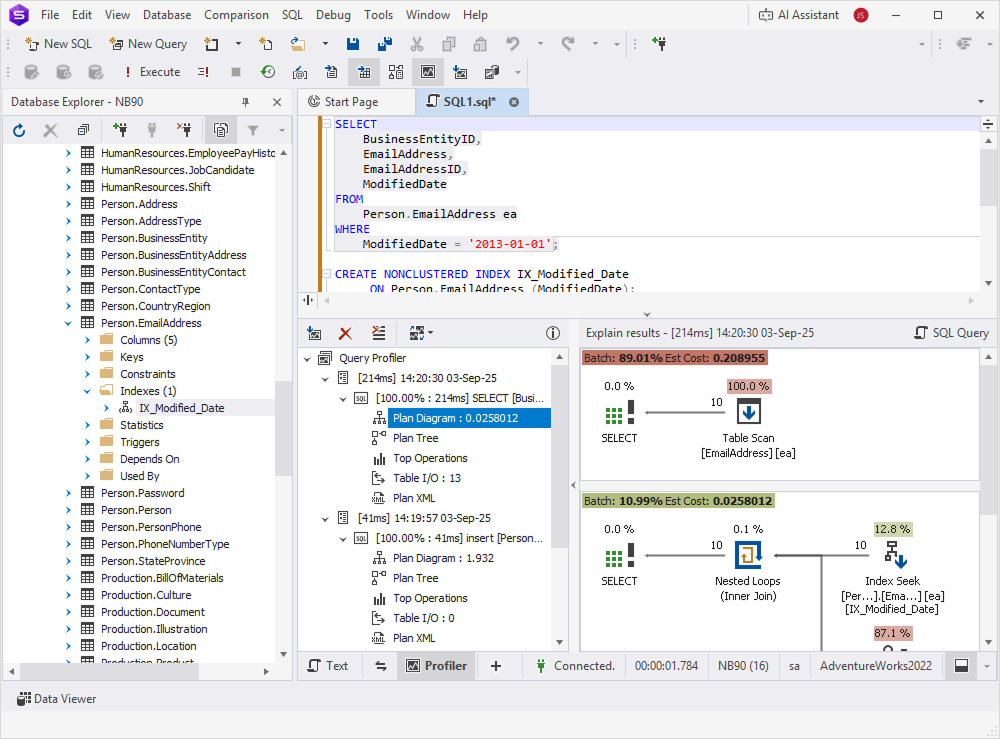
Example of a query with an index
CREATE NONCLUSTERED INDEX IX_Modified_Date
     ON Person.EmailAddress (ModifiedDate);
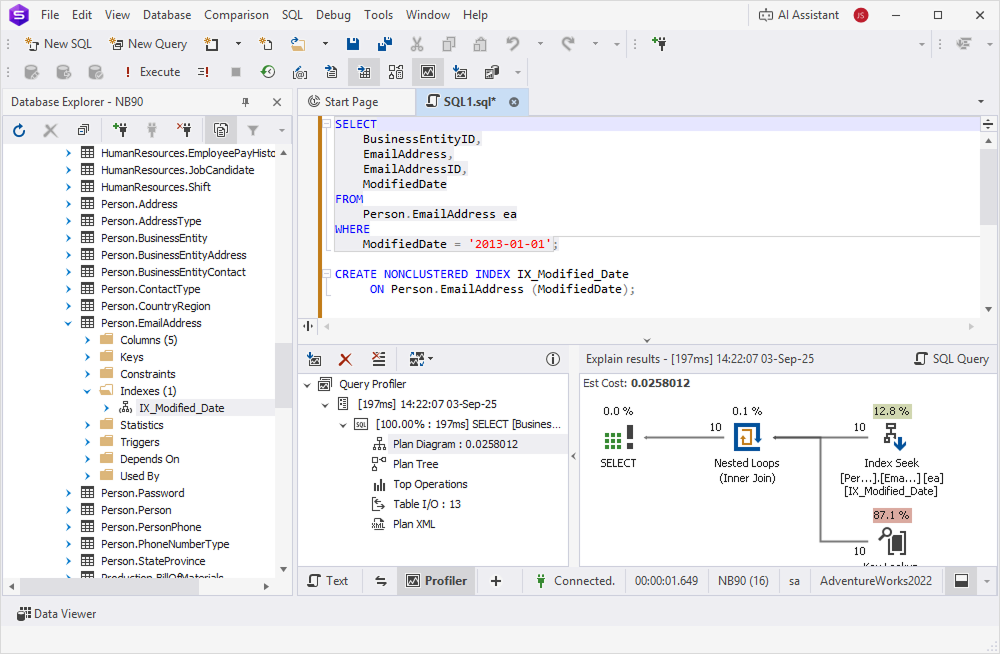
The results show that a query using an indexed column runs faster than the same query without an index.
Transform a UNION query into a PIVOT query
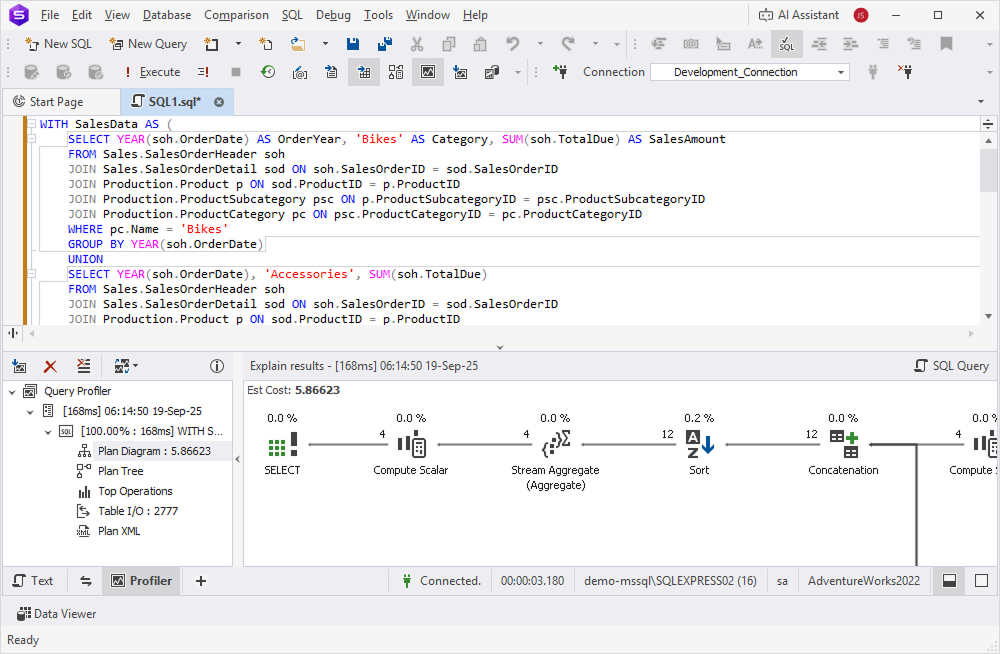
The UNION operator combines the results of two or more SELECT statements into a single result set. When you use several UNION operations, SQL Server must scan and process the data repeatedly, which can reduce performance.
In many cases, the UNION operator can be replaced with the PIVOT operator. PIVOT transforms rows into columns in a single scan, offering better efficiency and requiring fewer resources.
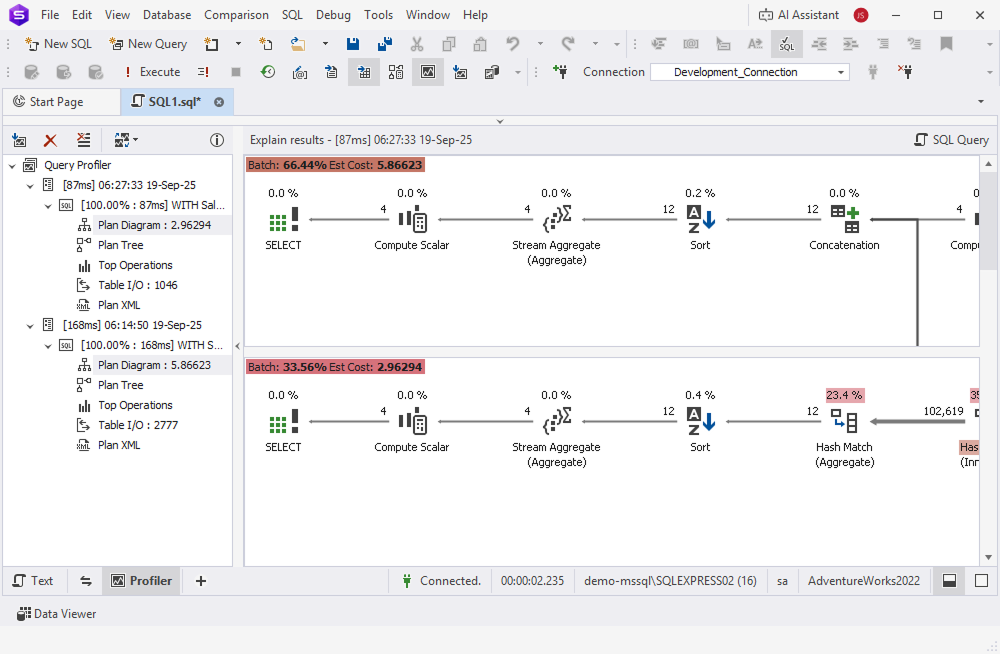
In this example, we will first measure the performance of a query using multiple UNION statements with Query Profiler. Then, we will use AI Assistant to modify the query and replace the UNION operator with the PIVOT operator, and then compare its performance.
Step 1: Compare performance using Query Profiler
1. On the toolbar, select New SQL, then click Query Profiling.
2. In the SQL document, enter a UNION query you want to test.
3. Click Execute.
Step 2: Modify the query using AI Assistant
1. On the toolbar, click AI Assistant, then select Open Chat Window.
2. Enter a prompt that includes the UNION query, then click Send.
3. Copy the optimized PIVOT query returned by AI Assistant.
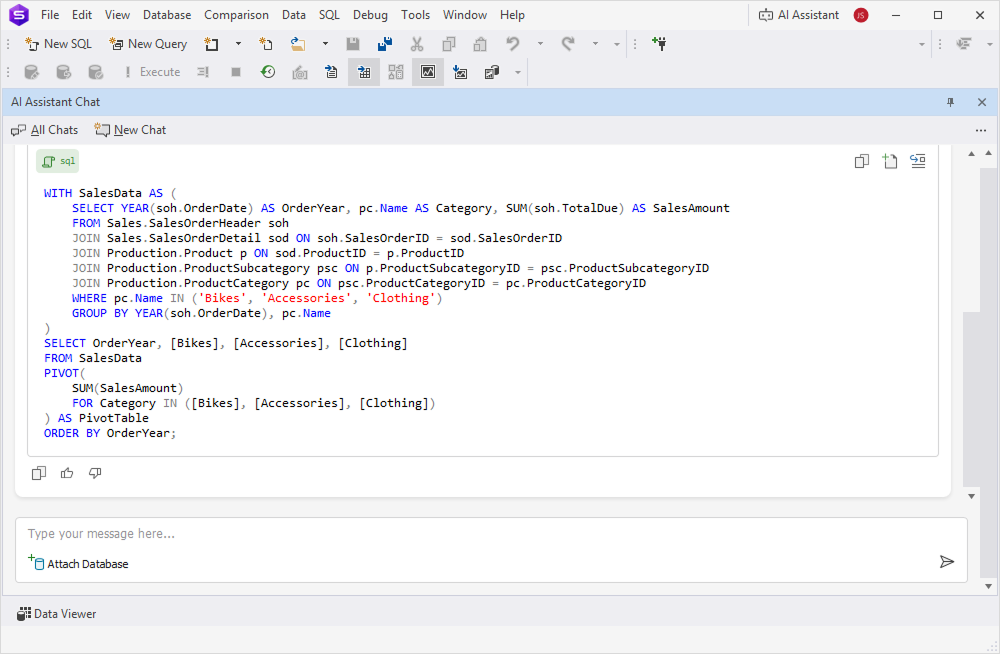
4. Paste it into the SQL document, then click Execute.
Click to open an example of a UNION query
WITH SalesData AS (
    SELECT YEAR(soh.OrderDate) AS OrderYear, 'Bikes' AS Category, SUM(soh.TotalDue) AS SalesAmount
    FROM Sales.SalesOrderHeader soh
    JOIN Sales.SalesOrderDetail sod ON soh.SalesOrderID = sod.SalesOrderID
    JOIN Production.Product p ON sod.ProductID = p.ProductID
    JOIN Production.ProductSubcategory psc ON p.ProductSubcategoryID = psc.ProductSubcategoryID
    JOIN Production.ProductCategory pc ON psc.ProductCategoryID = pc.ProductCategoryID
    WHERE pc.Name = 'Bikes'
    GROUP BY YEAR(soh.OrderDate)
    UNION
    SELECT YEAR(soh.OrderDate), 'Accessories', SUM(soh.TotalDue)
    FROM Sales.SalesOrderHeader soh
    JOIN Sales.SalesOrderDetail sod ON soh.SalesOrderID = sod.SalesOrderID
    JOIN Production.Product p ON sod.ProductID = p.ProductID
    JOIN Production.ProductSubcategory psc ON p.ProductSubcategoryID = psc.ProductSubcategoryID
    JOIN Production.ProductCategory pc ON psc.ProductCategoryID = pc.ProductCategoryID
    WHERE pc.Name = 'Accessories'
    GROUP BY YEAR(soh.OrderDate)
    UNION
    SELECT YEAR(soh.OrderDate), 'Clothing', SUM(soh.TotalDue)
    FROM Sales.SalesOrderHeader soh
    JOIN Sales.SalesOrderDetail sod ON soh.SalesOrderID = sod.SalesOrderID
    JOIN Production.Product p ON sod.ProductID = p.ProductID
    JOIN Production.ProductSubcategory psc ON p.ProductSubcategoryID = psc.ProductSubcategoryID
    JOIN Production.ProductCategory pc ON psc.ProductCategoryID = pc.ProductCategoryID
    WHERE pc.Name = 'Clothing'
    GROUP BY YEAR(soh.OrderDate)
)
SELECT
    OrderYear,
    SUM(CASE WHEN Category = 'Bikes' THEN SalesAmount ELSE 0 END) AS Bikes,
    SUM(CASE WHEN Category = 'Accessories' THEN SalesAmount ELSE 0 END) AS Accessories,
    SUM(CASE WHEN Category = 'Clothing' THEN SalesAmount ELSE 0 END) AS Clothing
FROM SalesData
GROUP BY OrderYear
ORDER BY OrderYear;
Example of an equivalent PIVOT query generated by AI Assistant
 WITH SalesData AS (
    SELECT YEAR(soh.OrderDate) AS OrderYear, pc.Name AS Category, SUM(soh.TotalDue) AS SalesAmount
    FROM Sales.SalesOrderHeader soh
    JOIN Sales.SalesOrderDetail sod ON soh.SalesOrderID = sod.SalesOrderID
    JOIN Production.Product p ON sod.ProductID = p.ProductID
    JOIN Production.ProductSubcategory psc ON p.ProductSubcategoryID = psc.ProductSubcategoryID
    JOIN Production.ProductCategory pc ON psc.ProductCategoryID = pc.ProductCategoryID
    WHERE pc.Name IN ('Bikes', 'Accessories', 'Clothing')
    GROUP BY YEAR(soh.OrderDate), pc.Name
)
SELECT OrderYear, [Bikes], [Accessories], [Clothing]
FROM SalesData
PIVOT(
    SUM(SalesAmount)
    FOR Category IN ([Bikes], [Accessories], [Clothing])
) AS PivotTable
ORDER BY OrderYear;
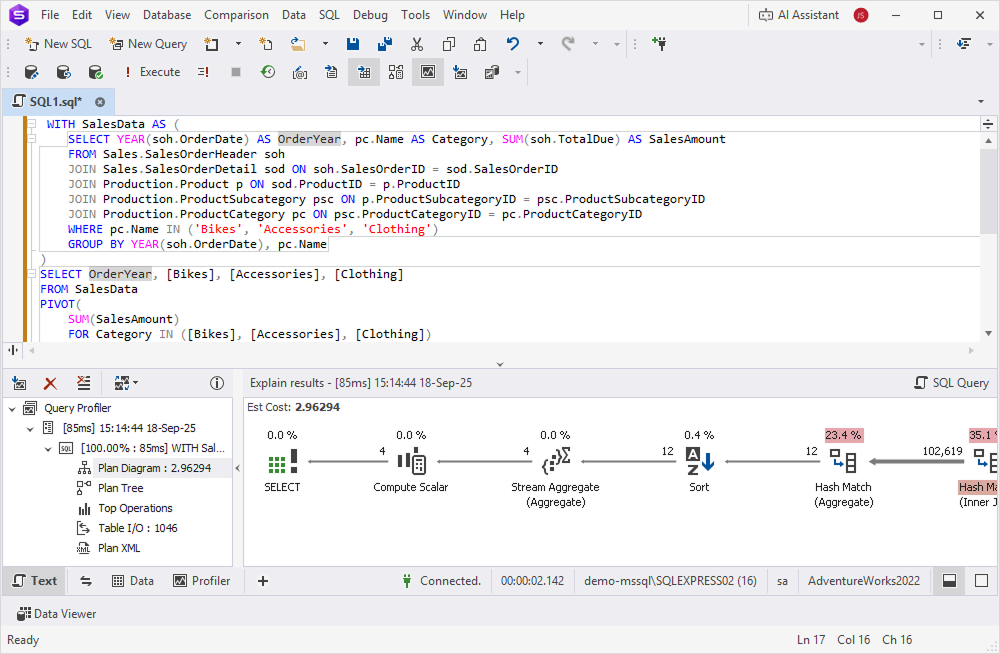
The PIVOT query ran faster and used fewer resources than the UNION query.
Best practices
To sum it up, along with using the dbForge Studio for SQL Server tools, such as Query Profiler, T-SQL Code Analyzer, Index Manager, and AI Assistant, follow these recommendations to optimize query performance.
| Recommendation | Details |
|---|---|
| Analyze before optimizing | Use Query Profiler to measure actual query performance before making changes. Optimization without measurement may introduce unnecessary complexity. |
| Compare execution plans | Review execution plans for both original and optimized queries to verify that changes improve performance. |
| Test in both environments | Verify query performance in both development and production environments, as results may differ due to different data volumes and server configurations. |
| Use explicit JOIN syntax | Prefer explicit JOIN syntax (INNER JOIN, LEFT JOIN) over implicit joins with comma-separated tables in the FROM clause for better readability and maintainability. |
| Evaluate subqueries case by case | Don’t assume JOINs are always faster than subqueries. Modern SQL Server optimizer often transforms subqueries into JOINs automatically. Test both approaches. |
| Avoid functions on indexed columns | Don’t apply functions to columns in WHERE clauses (e.g., YEAR(date_column) = 2023). Instead, use range filters (e.g., date_column >= '2023-01-01' AND date_column < '2024-01-01'). |
| Use sargable predicates | Write search arguments that allow SQL Server to use indexes efficiently. Avoid wrapping columns in functions, calculations, or type conversions. |
| Create targeted indexes | Add indexes on columns frequently used in WHERE, JOIN, and ORDER BY clauses. Use Index Manager to identify index fragmentation. |
| Consider index trade-offs | Remember that indexes speed up reads but slow down INSERT, UPDATE, and DELETE operations. Balance read and write performance requirements. |
| Use PIVOT for category aggregation | Replace multiple UNION queries with PIVOT when aggregating data across fixed categories to reduce table scans. |
| Know PIVOT limitations | PIVOT requires a predefined list of column values. For dynamic values, use dynamic SQL or alternative approaches. |
| Leverage AI Assistant | Use AI Assistant to suggest query optimizations and generate alternative query structures. |
| Use T-SQL Code Analyzer | Run code analysis to identify potential performance issues such as non-sargable predicates, missing indexes, and inefficient patterns. |
| Document optimization decisions | Record why specific optimizations were applied to help future maintenance and prevent regression. |
| Review statistics regularly | Ensure table statistics are up to date with UPDATE STATISTICS to help the query optimizer make accurate decisions. |
| Avoid premature optimization | Focus on queries that actually cause performance problems rather than optimizing all queries. |