Debugging a Trigger
This example shows how to debug a trigger in dbForge Studio for MySQL. Use the provided scripts to create sample objects in your test database.
Creating a Sample Trigger
Database Tables
Use the script available in Sample Script to Create Database Tables to create necessary tables.
Procedure
Use the script available in How To: Debug a Stored Procedure to the procedure used in the sample below.
Trigger
Use the script below to create the ScheduleDetail trigger that generates an error message in case inserted data contains NULL.
CREATE TRIGGER scheduledetail
BEFORE INSERT
ON scheduledetail
FOR EACH ROW
BEGIN

  SET @TimeSheetDate = new.TimeSheetDate;
  SET new.AbsenceCode = 'sicklist';
  IF @TimeSheetDate IS NULL
    THEN
    RESIGNAL SET MYSQL_ERRNO = 5;
  END IF;

END
Debugging a Trigger
To debug a MySQL trigger, do the following:
- In Database Explorer, choose your test database and expand the Triggers folder.
- Right-click the trigger you want to debug and click Compile > Compile for Debugging on the shortcut menu. The following message appears: Debug engine for stored routines will be deployed to a server.
- In the message that appears, select Deploy to continue the deploying process. The trigger will be successfully compiled with debug info.
- In Database Explorer > Triggers folder, double-click the ScheduleDetail trigger to open it.
-
Change the current view from Main to SQL.
Note
While opening a trigger, the Main view is set as default. You are not able to insert a breakpoint in this view.
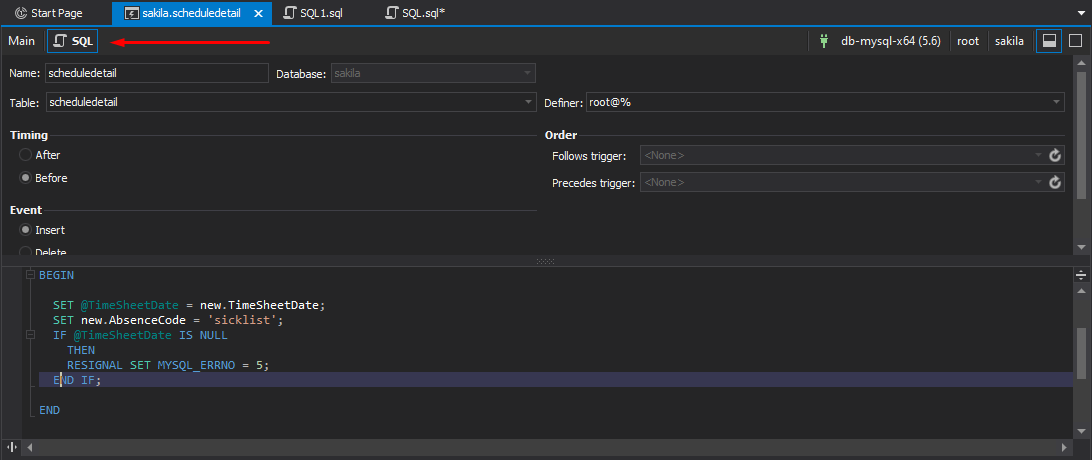
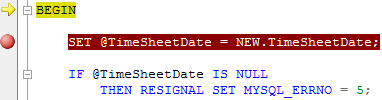
- To set a breakpoint for the trigger, right-click in the gray margin next to the SET statement and then click Insert Breakpoint. This step is obligatory: if you do not set a breakpoint in the trigger, you will skip over its code when you try to step into it.
- In the Procedures folder, right-click the procedure you want to debug and click Compile > Compile for Debugging on the shortcut menu. The stored procedure will be successfully compiled with debug info.
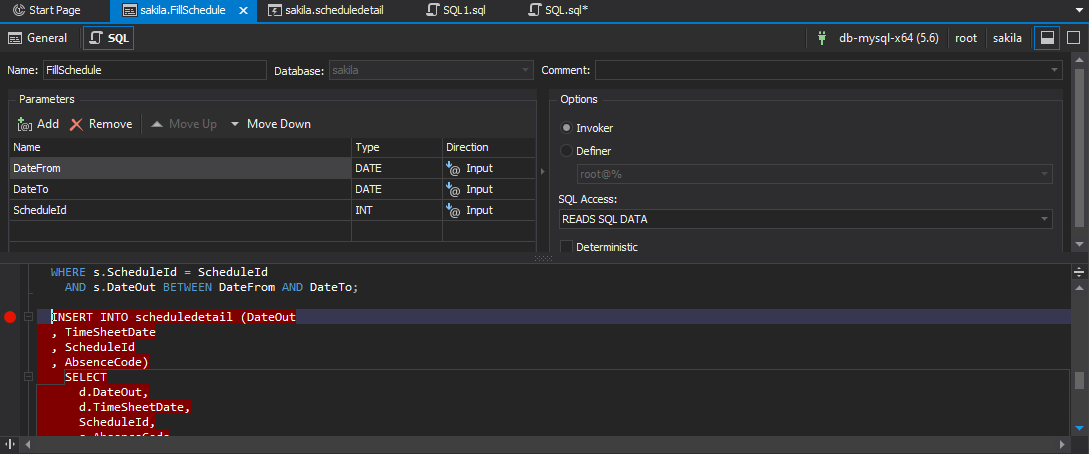
- In Database Explorer > Procedures folder, double-click the FillSchedule procedure to open it.
-
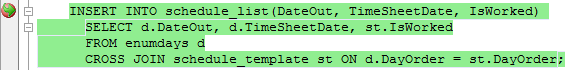
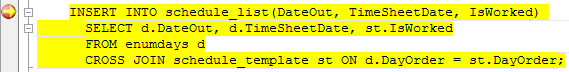
Switch to the SQL view, right-click in the gray margin next to the INSERT INTO schedule_list statement, and then click Insert Breakpoint on the shortcut menu.
- On the Standard toolbar, click
 Start Debugging.
 - In the Edit Parameters window, enter input values for the procedure and click OK.
-
Step through the code using the F11 key or the Step Into option, or press CTRL+F5 to move directly to the breakpoint. At the INSERT INTO schedule_list statement, when you press F11 again, you will step into the trigger.
-
Step through the trigger until you exit back to the stored procedure, and continue to the end.
Call Stack Window
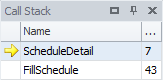
There are two database objects in the Call Stack window: the ScheduleDetail trigger and the FillSchedule procedure. You may notice the yellow arrow next to the ScheduleDetail trigger which identifies the stack frame where the execution pointer is currently located.
You can get back to the procedure source code by double-clicking the procedure in the Call Stack window.
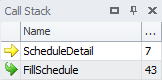
A ![]() green arrow indicates that you have stepped back to the parent code that has called the trigger.
green arrow indicates that you have stepped back to the parent code that has called the trigger.