Enable ODBC tracing on Windows
You can enable tracing for ODBC function calls using one of the following methods:
- In ODBC Data Source Administrator: Logs function calls from all ODBC applications.
- In the ODBC driver settings: Logs all function calls made by any Devart ODBC driver of the same version—either 32-bit or 64-bit.
Enable tracing using ODBC Data Source Administrator
1. In the Windows search box, type ODBC Data Sources, then open the appropriate version of the application (32-bit or 64-bit).
2. Select the Tracing tab.
3. Optional: Update the ODBC tracing options:
- To change the default log path, specify the new path under Log File Path.
- If the ODBC driver runs under a different user account, and you need to capture logs system-wide, select Machine-Wide tracing for all user identities.
- To use a custom dynamic-link library (DLL) instead of the default Microsoft-provided one, specify the path to your DLL under Custom Trace DLL.
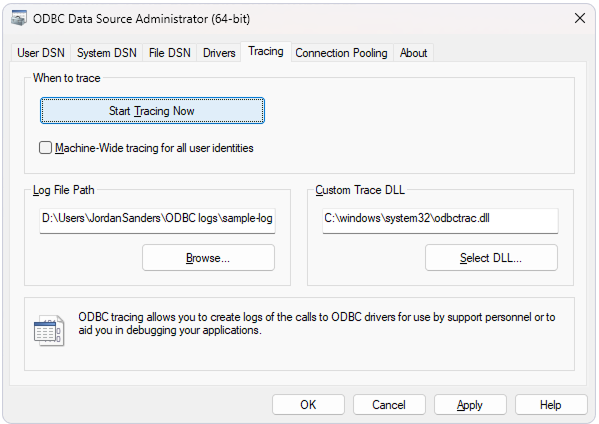
4. Click Start Tracing Now.
5. Once the issue is reproduced, click Stop Tracing Now to disable tracing.
Enable ODBC tracing in the driver settings
Note
You need a configured system Data Source Name (DSN). For instructions, see Configure a Windows DSN for Salesforce.
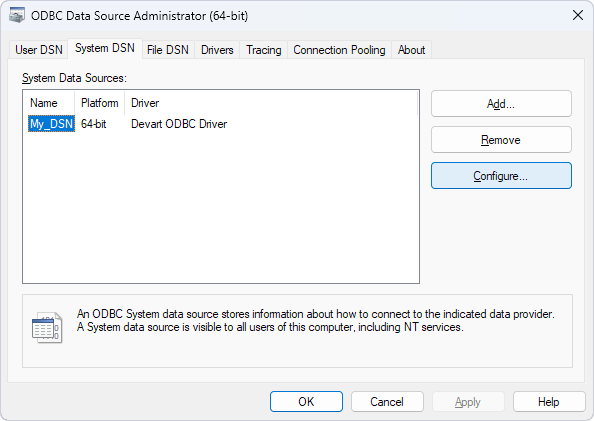
1. In the ODBC Data Source Administrator utility, on the User DSN or System DSN tab, select your DSN, then click Configure.
2. Select the Tracing tab.
3. Under Log File Path, enter the location where you want to save the file.
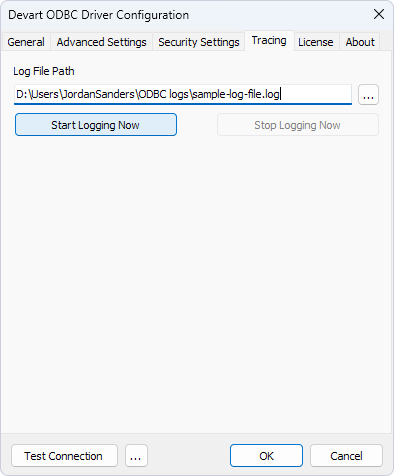
4. Click Start Logging Now.
5. Optional: To verify that tracing is active, click Test Connection and check whether new entries appear in the log file.
6. Click OK.
7. Once the issue is reproduced, click Stop Logging Now to disable tracing.