Collect performance and system information
dbForge Monitor enables you to monitor SQL Server performance in real-time by collecting comprehensive system and performance data.
Monitor SQL Server performance
To start monitoring SQL Server performance, in Object Explorer, right-click the required connection and select Monitor > Show Monitor.
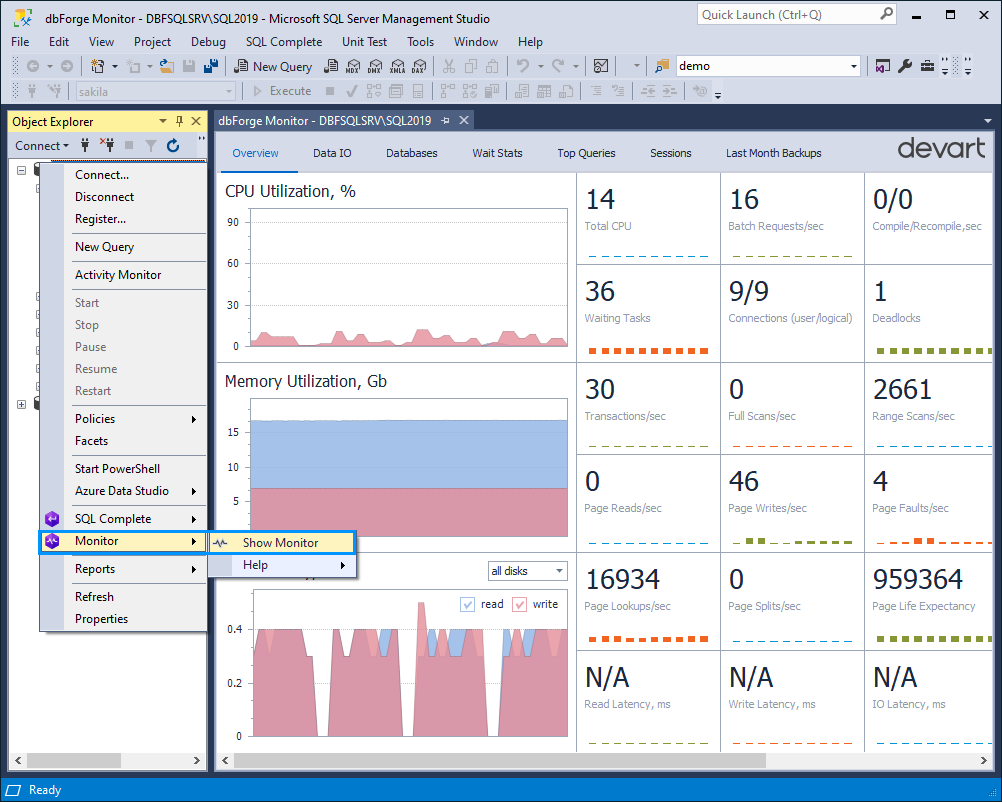
dbForge Monitor opens, displaying the tabs with performance metrics and statistics. They help you monitor SQL performance and identify and resolve issues or bottlenecks efficiently.
Note
dbForge SQL Monitor does not log data. It only lets you view the current state of databases and monitor SQL Server performance in real-time.
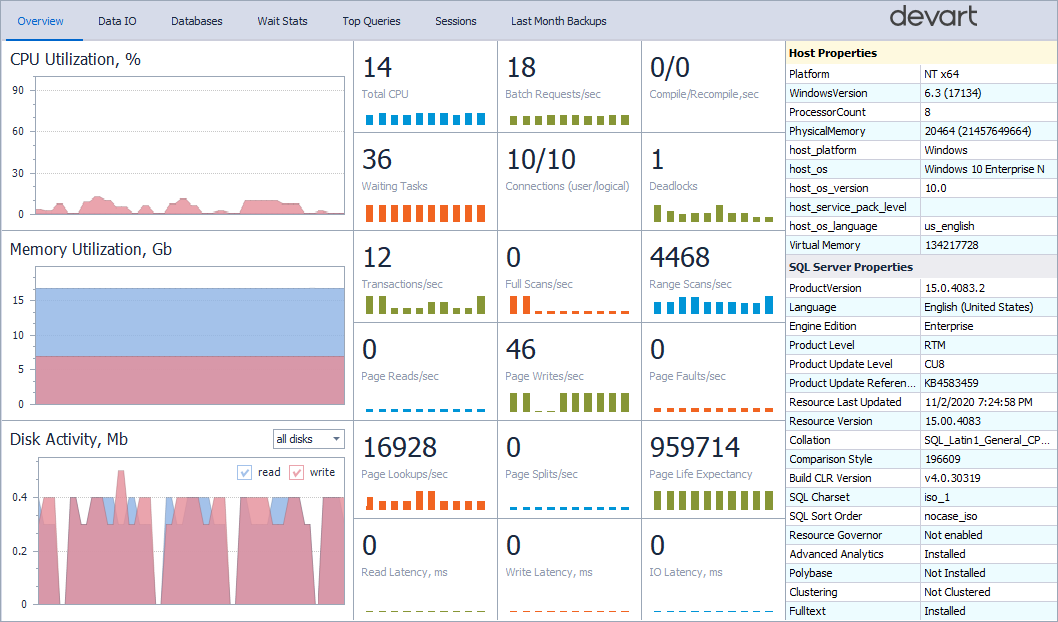
Overview
The Overview tab provides real-time metrics for monitoring SQL Server performance. You can assess CPU and memory usage, disk activity, waiting tasks, deadlocks, and more. The right side of the window also displays the detailed Host Properties and SQL Server Properties sections.
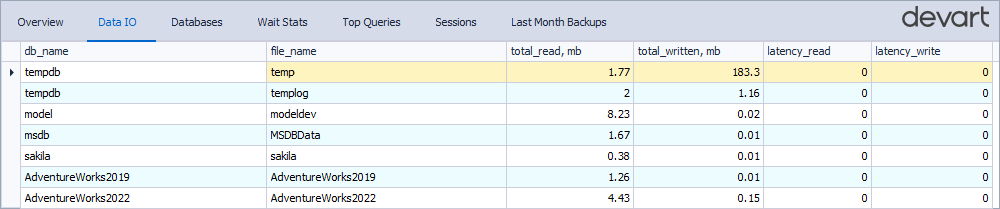
Data IO
The Data IO tab shows statistics for input and output operations, including total read and write volumes and latency for each database file.
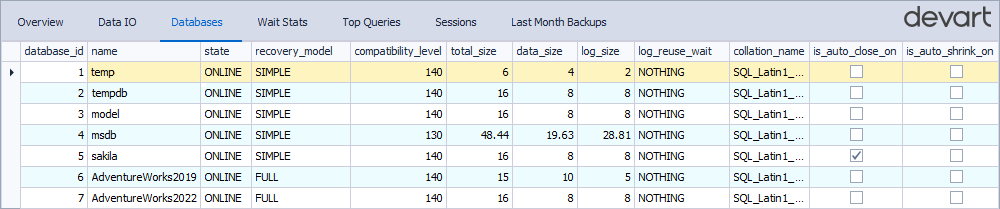
Databases
The Databases tab displays information about databases on the monitored SQL Server instance. It helps you assess key metrics, such as the database state, recovery model, size, and collation, and take action if performance issues are detected.
Wait Stats
The Wait Stats tab displays waiting tasks encountered by execution threads due to unavailable or busy resources. You can view details, such as wait type, duration, and count.
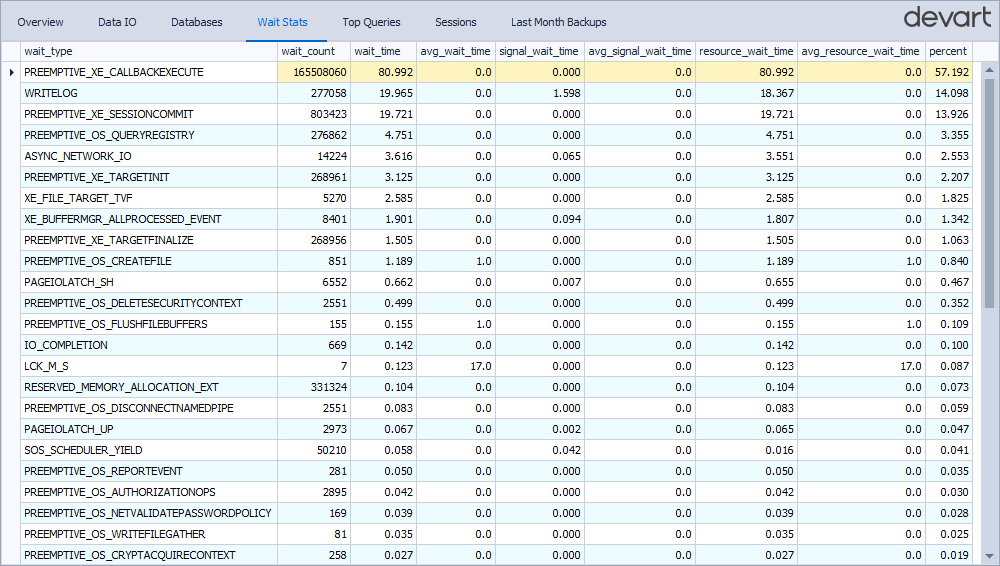
The table describes all waiting tasks available on the Wait Stats tab.
| Name | Description |
|---|---|
SOS_WORK_DISPATCHER |
Occurs when SQL Server waits to dispatch tasks to available worker threads managed by the SOS scheduler. |
PREEMPTIVE_OS_QUERYREGISTRY |
Occurs when SQL Server waits for the Windows API to complete a registry read or write operation while in preemptive mode. |
WAIT_XTP_RECOVERY |
Occurs when the database recovery waits for the recovery of memory-optimized objects to finish. |
ASYNC_NETWORK_IO |
Occurs when the server waits for the client application to consume data. |
PAGEIOLATCH_SH |
Occurs when SQL Server waits for a data file page to be read from the disk and put into memory in shared mode. |
IO_COMPLETION |
Occurs when a task waits for an I/O operation to complete. |
LCK_M_S |
Occurs when a transaction waits to acquire a shared lock on a resource. |
PREEMPTIVE_OS_DELETEFILE |
Occurs when SQL Server switches to preemptive mode to delete a file at the OS level. |
WRITELOG |
Occurs when a task waits for a log flush to disk to complete. |
XE_BUFFERMGR_ALLPROCESSED_EVENT |
Occurs when a background thread flushes Extended Events session buffers to their targets. |
PREEMPTIVE_OS_REPORTEVENT |
Occurs when a thread calls the Windows ReportEvent function. |
PREEMPTIVE_OS_DELETESECURITYCONTEXT |
Occurs when a thread calls the Windows DeleteSecurityContext function. |
PREEMPTIVE_OS_FLUSHFILEBUFFERS |
Occurs when a thread calls the Windows FlushFileBuffers function. |
PREEMPTIVE_XE_SESSIONCOMMIT |
Occurs when a thread switches to preemptive mode as part of committing changes to the list of Extended Event sessions on the instance. |
WAIT_ON_SYNC_STATISTICS_REFRESH |
Occurs when SQL Server waits for updated statistics to finish before running the query. |
PREEMPTIVE_OS_CREATEFILE |
Occurs when a thread uses the Windows CreateFile function to create new files and open existing ones for reading. |
PREEMPTIVE_OS_LOADLIBRARY |
Occurs when a thread calls the Windows LoadLibrary function. |
PREEMPTIVE_OS_WRITEFILEGATHER |
Occurs when a thread calls the Windows WriteFileGather function. |
THREADPOOL |
Occurs when a task waits for a worker thread to become available. |
SECURITY_CNG_PROVIDER_MUTEX |
Occurs when a thread waits to acquire a mutual exclusion lock related to Cryptography Next Generation (CNG) security provider operations in SQL Server. |
ASYNC_IO_COMPLETION |
Occurs when SQL Server waits for asynchronous I/O operations, such as reading from or writing to disk, to complete. |
PAGEIOLATCH_EX |
Occurs when SQL Server waits for a data page to be read from disk into memory in exclusive mode. |
PREEMPTIVE_OS_DISCONNECTNAMEDPIPE |
Occurs when SQL Server waits for the operating system to complete a named pipe disconnection operation outside the SQL Server scheduling framework. |
PREEMPTIVE_OS_AUTHORIZATIONOPS |
Occurs when SQL Server waits for the operating system to complete an authorization-related operation, such as checking user permissions, outside SQL Server’s cooperative scheduling. |
RESERVED_MEMORY_ALLOCATION_EXT |
Occurs when SQL Server waits while attempting to allocate reserved memory from its internal memory pool, usually under memory pressure or during high-demand operations. |
PREEMPTIVE_OS_GETFILEATTRIBUTES |
Occurs when SQL Server switches to preemptive mode to get file attributes at the OS level. |
PREEMPTIVE_OS_NETVALIDATEPASSWORDPOLICY |
Occurs when SQL Server waits for the Windows API call that validates a password against the domain or local security policy during login or password change operations. |
PREEMPTIVE_OS_CLOSEHANDLE |
Occurs when SQL Server waits for the Windows API CloseHandle function to release a handle to an operating system resource, such as a file, thread, or process. |
PREEMPTIVE_OS_CRYPTACQUIRECONTEXT |
Occurs when SQL Server waits for the Windows Cryptographic API CryptAcquireContext function, which is used to acquire a handle to a cryptographic service provider (CSP) for encryption or decryption operations. |
PREEMPTIVE_XE_TARGETINIT |
Occurs when SQL Server waits for an external Extended Events (XE) target to initialize before it can begin processing or dispatching events to that target. |
PREEMPTIVE_XE_CALLBACKEXECUTE |
Occurs when SQL Server yields control to the operating system while executing a callback function associated with an Extended Events (XE) session, allowing external processing to complete. |
PREEMPTIVE_OS_CREATEDIRECTORY |
Occurs when SQL Server waits for the Windows API CreateDirectory function to complete while creating a directory on the file system. |
SOS_SCHEDULER_YIELD |
Occurs when a thread voluntarily yields the CPU to allow other threads to run. |
PAGEIOLATCH_UP |
Occurs when SQL Server waits for a data page to be read from disk into memory in update mode. |
PAGELATCH_SH |
Occurs when a thread waits for shared access to a page already in memory. |
PREEMPTIVE_FILESIZEGET |
Occurs when SQL Server tries to get the size of a file required for a query or operation. |
PREEMPTIVE_OS_REVERTTOSELF |
Occurs when a session waits for an operation to be completed by the operating system. |
PREEMPTIVE_XE_TARGETFINALIZE |
Occurs when a session waits for a target to finish executing an Extended Events event. |
WRITE_COMPLETION |
Occurs when SQL Server waits for a write operation to complete. |
PREEMPTIVE_SERVICE_CONTROL_MANGER |
Occurs when SQL Server waits for the Windows Service Control Manager to complete an operation, such as querying or managing system services, outside SQL Server’s control. |
CMEMTHREAD |
Occurs when multiple threads try to access the same memory structure simultaneously, and one has to wait for access. |
PAGELATCH_EX |
Occurs when a thread waits for exclusive access to a page already in memory. |
LCK_M_SCH_M |
Occurs when a transaction waits to acquire a schema modification lock. |
PREEMPTIVE_OS_QUERYCONTEXTATTRIBUTES |
Occurs when SQL Server calls Windows to query security context attributes, such as permissions or tokens, and it has to wait while Windows responds. |
LATCH_EX |
Occurs when a thread waits for exclusive access to a non-buffer latch. |
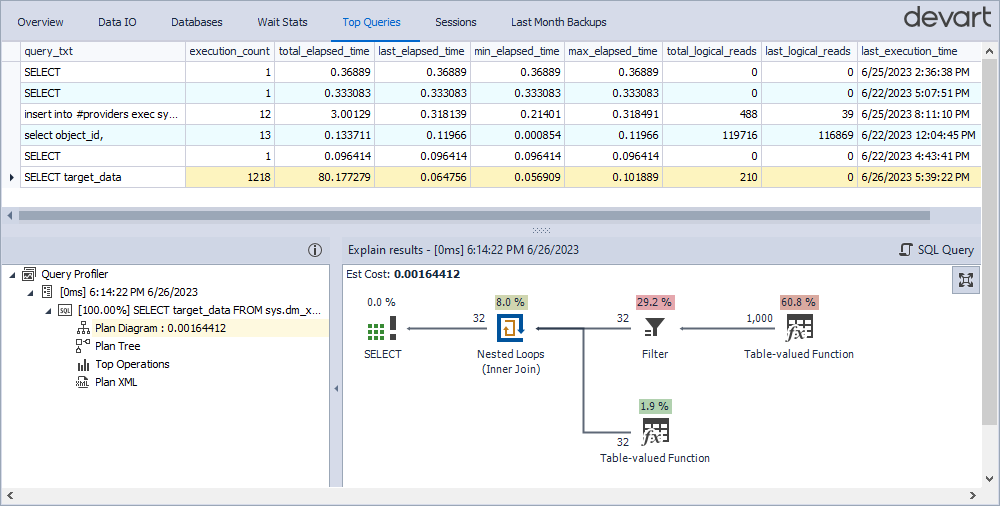
Top Queries
The Top Queries tab lists the most resource-intensive queries run on the server. It includes query text and profiling data to help optimize performance. Each query shows its cost as a percentage of the total batch cost.
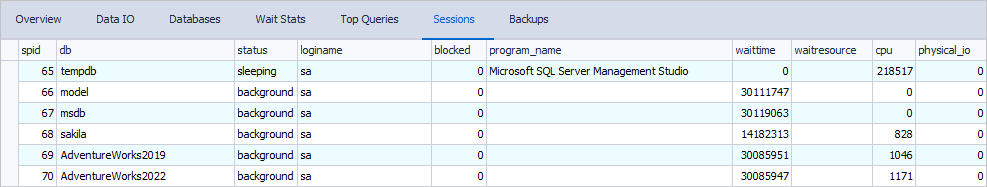
Sessions
The Sessions tab shows the session-related information for effective monitoring and analysis, including the associated database and user, session status, wait time, CPU load, physical I/O, and the name of the active program.
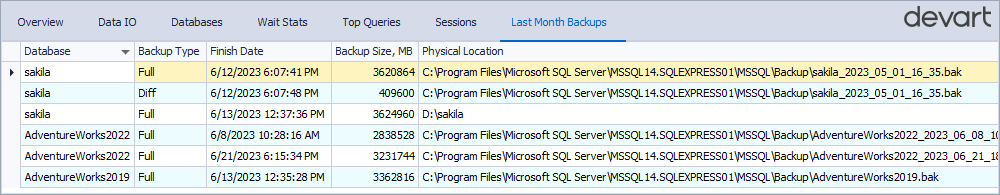
Last Month Backups
The Last Month Backups tab provides statistics on recent database backups, including the database name, backup type, size, and file location. If a database isn’t listed, it means that it hasn’t been backed up recently or has no backup.