Profiling SQL Queries
You can use the Query Profiler tool to debug, troubleshoot, monitor, and measure your application SQL statements and stored procedures. If your application has a performance problem that you think might be caused by a particularly long-running query, you can analyze query durations.
In this topic, we will review how to profile a simple query. As an example,we will use the AdventureWorks2012 test database from Microsoft.
Profiling an SQL statement
We are going to select all persons from the Person table where the first name is “Robin”.
- Right-click the bottom panel of an SQL document, and select Profiler on the shortcut menu.
-
In the text editor, type the following script:
SELECT * FROM AdventureWorks2012.Person.Person WHERE FirstName = 'Robin' -
Click Execute. The Plan Diagram window opens.
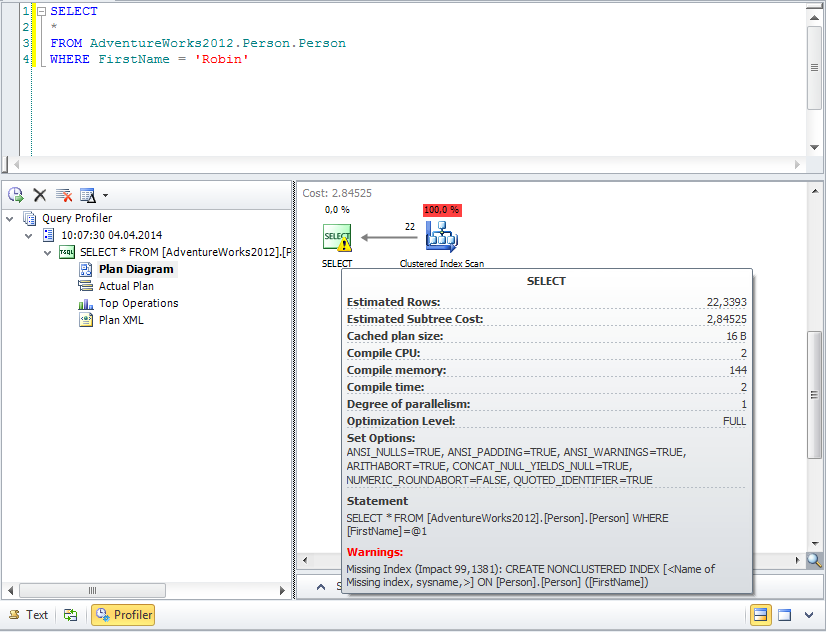
Note that the select icon contains the exclamation mark icon that warns about a shortcoming. A tooltip appears automatically when you pause the mouse pointer over the select icon. The bottom part of the tooltip contains the warning message that tell us that the index is missing.
To add the index:
- In Database Explorer, click an icon next to the Person table to expand it.
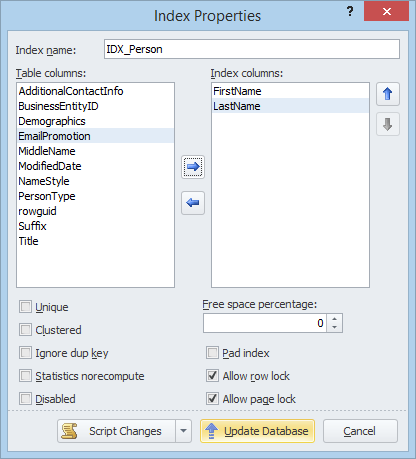
- Right-click the Index folder and then click New Index on the shortcut menu. The Index Properties dialog box opens.
- In the Table columns list box, select FirstName and click the corresponding button to add one to the Index columns list box. Then, select LastName and click the same button to add one to the Index columns list box.
-
Click Update Database.
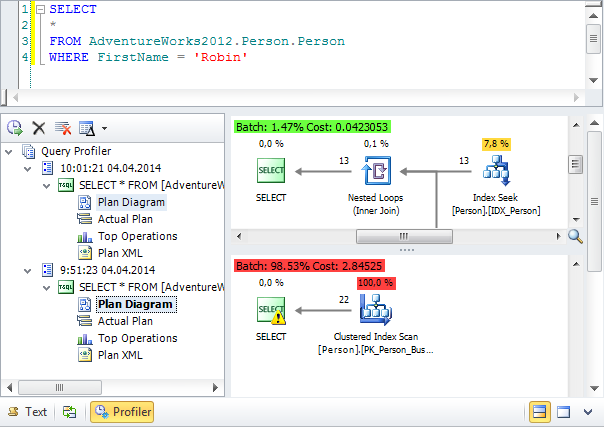
Now, we can get back to the Query Profiler and click the Get New Results button.
Each time you get profiling results for the executed query, they appear in the tree view as a new node with time and date of query execution. When editing your query, you want to know whether your changes reduce query execution time or not. Query Profiler can quickly compare the profiling results. To compare results, hold the CTRL key and select both plan diagrams.
Note
When you save the query file after getting the query profiling results, the latter will be automatically stored in the .design file.