Displaying Database Objects on Diagram
Diagram Objects Colors
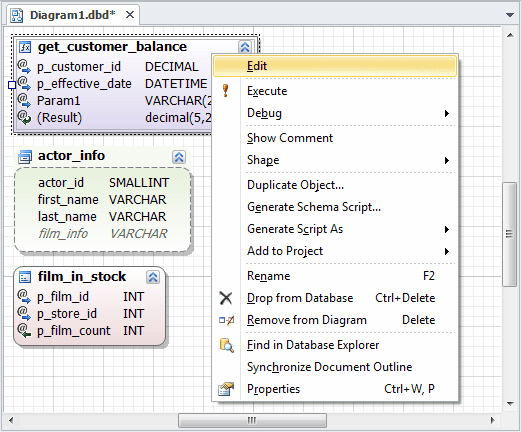
Views and stored routines are presented as differently colored shapes on the diagram. You can manage these like table shapes, except for some differences. Unlike table shapes, these shapes have only two size handles, which allows you to resize the shape width. View shapes contain view columns, and stored routine shapes contain their parameters. They don’t have any additional compartments.
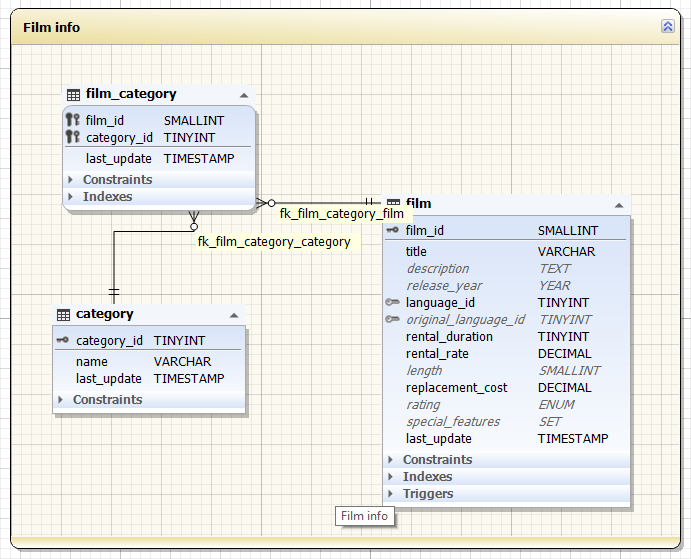
Triggers are displayed on the diagram just like constraints and indexes - in their own compartments on the table shapes. You can work with them in the same way as with constraints and indexes.
Organizing Diagram Shapes with Containers
If you want to build a complex diagram with many shapes or make a diagram with tables from different schemas, you may use containers to group the shapes. Or you may use containers for storing only specific kinds of database objects.
Containers are resizable colored boxes with a caption, which you can use to place other diagram shapes into. Any diagram object can be placed into container, even another container. Relation between table shapes are kept when the shapes are in different containers. Container color can be customized and you can specify container caption, so you can group diagram shapes into several containers, each with its own name and color. So, when building diagram with objects of several schemas, you may create a container for each schema and name them after schemas, then place objects from each schema into the corresponding container.
Containers have their own grid inside of them for positioning shapes. If there are not enough place in the container, scroll bars appear, allowing you to scroll the container and to view all shapes in the container. Containers can be collapsed like any other shape by clicking the Collapse button.
Working with Containers
To create a container:
- Right-click a diagram and select New, and then click Container from the shortcut menu.
or
- Click the New Container button on the Devart - Database Diagram toolbar and click the diagram.
When the container is added to the diagram, you may drag shapes to it. Note that when you are dragging the shape, if the mouse pointer was over the container, the dragged shapes will be dropped to the container, even if the most part of the dragged selection was not over the container. The same is about dragging shapes out of the containers.
To change the container color, right-click the container and choose a required color from the Color menu.
To rename the container, click it and hit F2 key or right-click it and choose Rename from the shortcut menu.
To drop the container from the diagram, click it and hit the DELETE key or right-click it and choose Remove from Diagram from the shortcut menu. Note that all shapes inside the container will be dropped from the diagram too, but the corresponding database objects will not be dropped from database.