Getting Query Profiling Results
This topic explains how to obtain query profiling results using Query Profiler.
- Open a query file and click the
 Query Profiling Mode button on the Devart - SQL toolbar
to activate the Query Profiler tool.
Query Profiling Mode button on the Devart - SQL toolbar
to activate the Query Profiler tool. -
Execute the query by clicking the Execute button. The Profiler document view opens. See the query profiling results displayed on three tabs - Plan, Session Statistics.
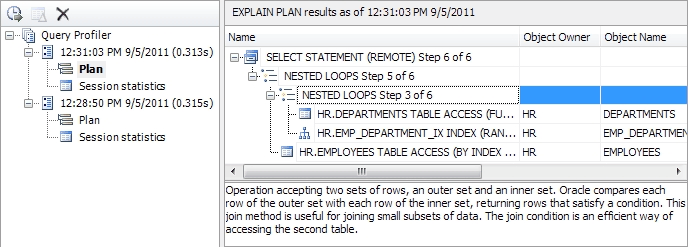
- After you have made changes in the query, click the
 Get New Results button in the Profiler document view. New profiling results appear
in the tree view as a new node with time and date of query execution. You can easily distinguish and navigate to them.
Get New Results button in the Profiler document view. New profiling results appear
in the tree view as a new node with time and date of query execution. You can easily distinguish and navigate to them.
Note
When you save the query file after getting the query profiling results, the latter will be automatically stored in the .Design file.