Debugging a Trigger
This example shows how to debug a trigger in dbForge Fusion for Oracle. Use provided scripts to create sample objects in your test database.
Creating a Sample Trigger
Procedure
Use the script available in How To: Debug a Stored Procedure to the procedure used in the sample below.
Trigger
Use the script below to create the IU_SCHEDULE_DETAIL trigger that generates an error message in case when Timesheetdate is not equal to the first date of a month.
CREATE OR REPLACE TRIGGER IU_SCHEDULE_DETAIL
  BEFORE INSERT
  ON SCHEDULE_DETAIL
  FOR EACH ROW
BEGIN

  IF (GETFIRSTDAYOFMONTH(:NEW.DATEOUT) <> :NEW.TIMESHEETDATE)
  THEN
    RAISE_APPLICATION_ERROR(-20000, '');
  END IF;

END;
Debugging a Trigger
To debug the Oracle trigger:
- In Database Explorer, choose your test database.
- Expand the Triggers folder, and then double-click the IU_SCHEDULE_DETAIL trigger to open it.
- Change the current view from Main to SQL.
Note
While opening a trigger the Main view is set as default. You are not able to insert a breakpoint in this view.
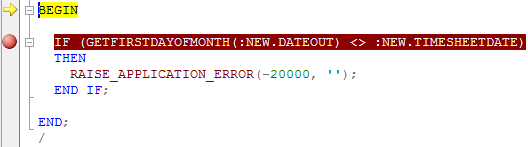
- Set a breakpoint for the trigger. Left-click in the gray margin next to the SET statement to set a breakpoint in the trigger. This step is obligatory: if you do not set a breakpoint in the trigger, you will skip over its code when you try to step into it.
- Expand the Procedures folder, and then double click the FILLSCHEDULE procedure to open it.
-
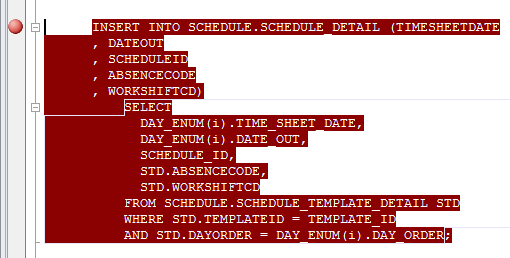
Set a breakpoint for the stored procedure that will fire the trigger. Left-click in the gray margin next to the INSERT INTO SCHEDULE.SCHEDULE_DETAIL statement.
- Click Start Debugging, and enter input parameters for the procedure.
-
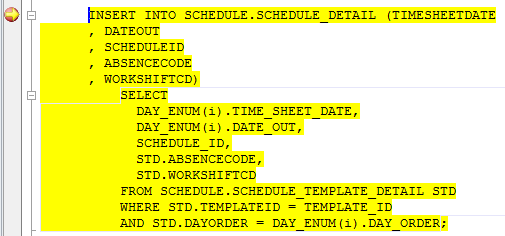
Step through the code using the StepInto Step Into button to move directly to the breakpoint. At the INSERT INTO SCHEDULE.SCHEDULE_DETAIL statement, when you click Step Into again, you will step into the trigger.
-
Step through the trigger until you exit back to the stored procedure, and continue to the end.
Call Stack Window
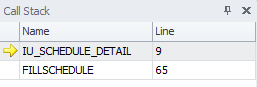
There are two database objects in the Call Stack window: the IU_SCHEDULE_DETAIL trigger and the FILLSCHEDULE procedure. You may notice the yellow arrow next to the IU_SCHEDULE_DETAIL trigger which identifies the stack frame where the execution pointer is currently located.
You can get back to the procedure source code by double-clicking the procedure in the Call Stack window.
![]()
A green arrow indicates that you have stepped back to the parent code that has called the trigger.
![]()