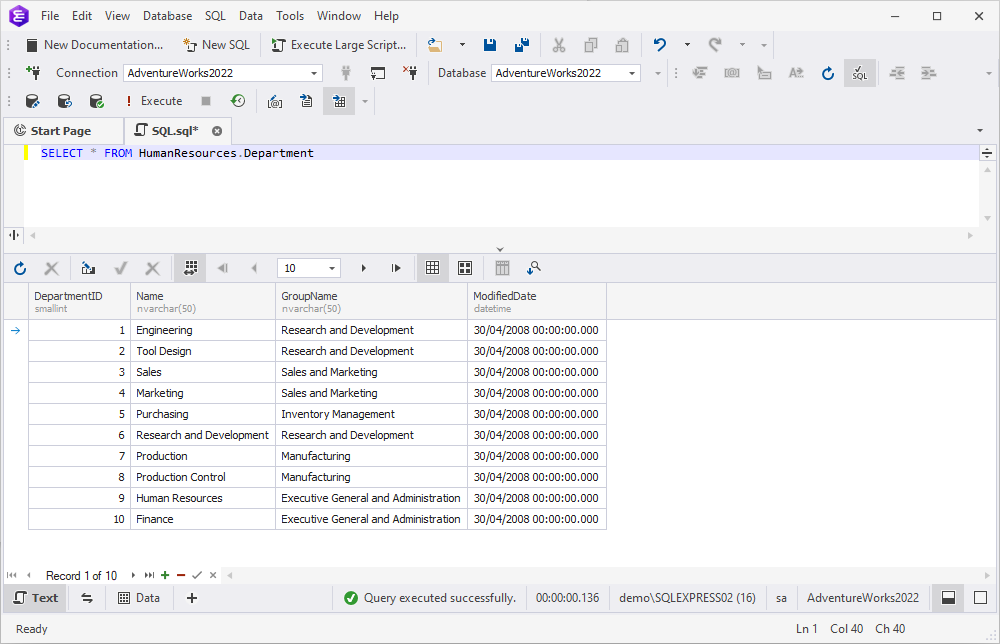
View and edit data in the Grid View mode
Data Viewer lets you view and edit data directly in the grid, just like in an Excel spreadsheet.
Retrieve data for viewing
Execute a query that returns data.
Results output patterns
There are two patterns for the results output: Paginal mode and Infinite scrolling.
The Paginal mode splits data into pages and is used to display data with a large number of records.
By default, the paginal mode displays 1,000 records per page. If your query returns more than 1,000 records and you wish to view them all on a single page, you can set a custom number of records:
- from the Data Editor: On the Data Editor toolbar, enter a number of records larger than the total amount of records in the table.
- from the Options window: On the ribbon, select Tools > Options. In the window that opens, navigate to Data Editor > General and specify the value in the Initial page size field. Click OK to save the changes.
If you turn off the paginal mode, the Infinite scrolling pattern will be activated, which loads data continuously as the user scrolls down the page and allows retrieving all data at once.
If a table contains more than 1000 records and the paginal mode is off, Data Generator can return 302+ records after the SELECT statement execution. It means that the first 302 records are read in the finishing mode, and the + sign means that there are more to load. To see the rest of the data, you need to scroll the data in the grid or press Ctrl + End.
Note
If you want to retrieve all data from a table with a large number of records, you will get a message warning you about the possibility of the Out of memory exception. You can choose to continue retrieving data, cancel retrieving data, or turn on the Paginal mode.
Manipulate the results output
You can use a rich set of data management options from the shortcut menu.
To change the column order and width, as well as group them by order, drag column headers to the required place. Additionally, you can fit the column width to the column content by right-clicking the required header and selecting Best Fit on the shortcut menu. To adjust the widths of all columns at once, select Best Fit (all columns). Note that this operation can take some time if there are many records in the grid.
You can set the background and foreground colors for the grid rows. This can be done separately for odd and even rows, focused rows, selected rows, focused cells, or group rows.
Data rows can be viewed, edited and printed as cards. To learn more, refer to Viewing and editing data in the Card View mode.
To simplify the subsequent data analysis, you can use the following features:
- Sorting and grouping data in the grid
- Hiding columns and filtering data in the grid
- Auto-search mode
Refresh data
To refresh data, use one of the following options:
- On the Data menu, select Refresh
- Right-click the results grid and select Refresh
- On the results grid toolbar, select Refresh
- Press F5
To abort an overly long refresh operation, select Stop Refresh on the Data menu or on the toolbar.
If you’ve edited the query text and applied changes, run the Execute command anew instead of refreshing the grid to get updated data.
View and edit data in Data Viewer
You can view and edit data in the built-in Data Viewer. To open the Data Viewer, use one of the following options:
- Right-click the required cell and select Data Viewer.
- Press the CTRL+W, R keyboard shortcut.
- On the ribbon, select View > Data Viewer.
The Data Viewer toolbar has the following controls:

 Save Data (Ctrl+S) allows saving data to a file.
 Copy (Ctrl+C) allows copying data to the clipboard.
The following controls allow viewing data in multiple formats:
 Hexadecimal View (Ctrl+1)
 Text View (Ctrl+2)
 XML View (Ctrl+3)
 HTML View (Ctrl+4)
 Web View (Ctrl+5)
 Rich Text View (Ctrl+6)
 PDF View (Ctrl+7)
 JSON View (Ctrl+8)
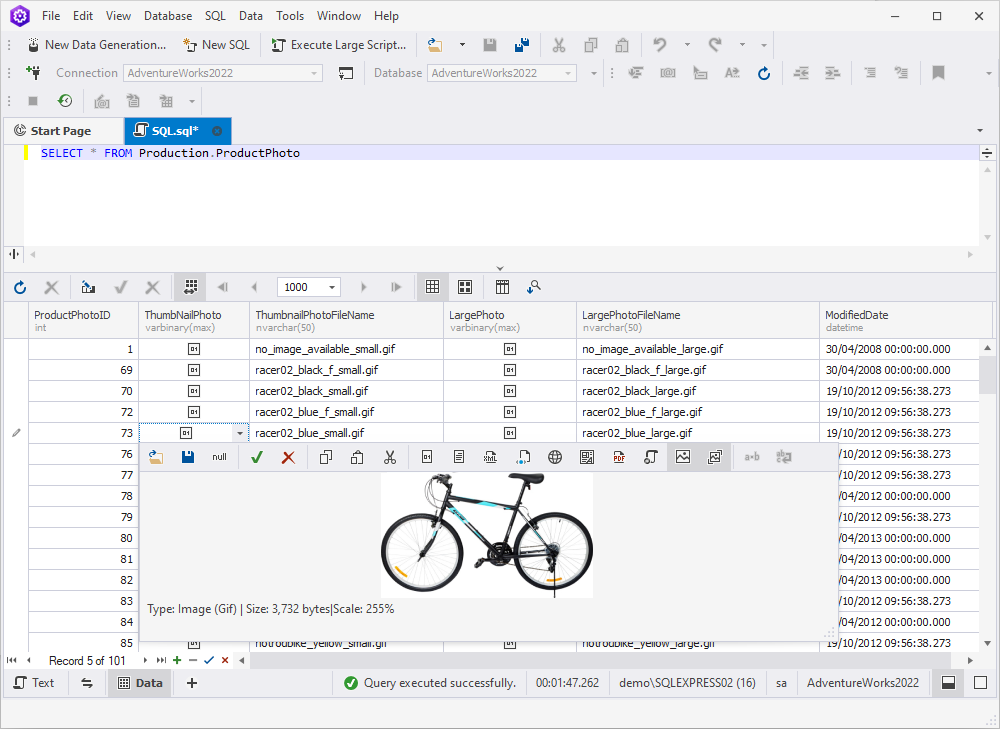
 Image View (Ctrl+9)
 Spatial View - Geometry (Ctrl+Alt+0)
 View White Space makes white spaces visible.
 Word Wrap adjusts the display of long text within cells or columns. When it is activated, the text automatically wraps onto the next line, making all the content visible within the cell’s width.
Edit data in Data Editor
When dbForge Documenter executes a statement returning a result set, the retrieved data is displayed in the same SQL document in Data Editor.
The Data Editor toolbar has the following controls:

 Refresh and Stop Refresh let you refresh and stop refreshing data in the grid, repectively.
 Cached Updates Mode allows you to apply data updates in a single batch, thus emulating a separate transaction. If this mode is activated, your data changes will be stored locally on the client side until you click Apply Changes. If there is no need for the changes to be applied, click Cancel Changes. If you close a document with Cached Updates Mode activated, all the changes made since the latest Apply Changes command will be canceled.
 Paginal Mode allows switching to the paginal mode.
 These controls allow to Go to First Page, Go to Previous Page, select the number of records per page, Go to Next Page, and Go to Last Page, respectively.
 These controls allow switching between Grid View and Card View.
 Show Group by Box allows grouping data by column.
 Auto-search Mode activates the auto-search mode.
Note
Computed columns always remain in the read-only mode and cannot be edited.
The bottom of the grid has the following controls:

 : These controls let you navigate down the grid one record at a time, or instantly get to the first or the last record in the grid.
 : These controls let you append or delete records from the grid.
 : These controls let you apply or cancel changes made during editing.
Note
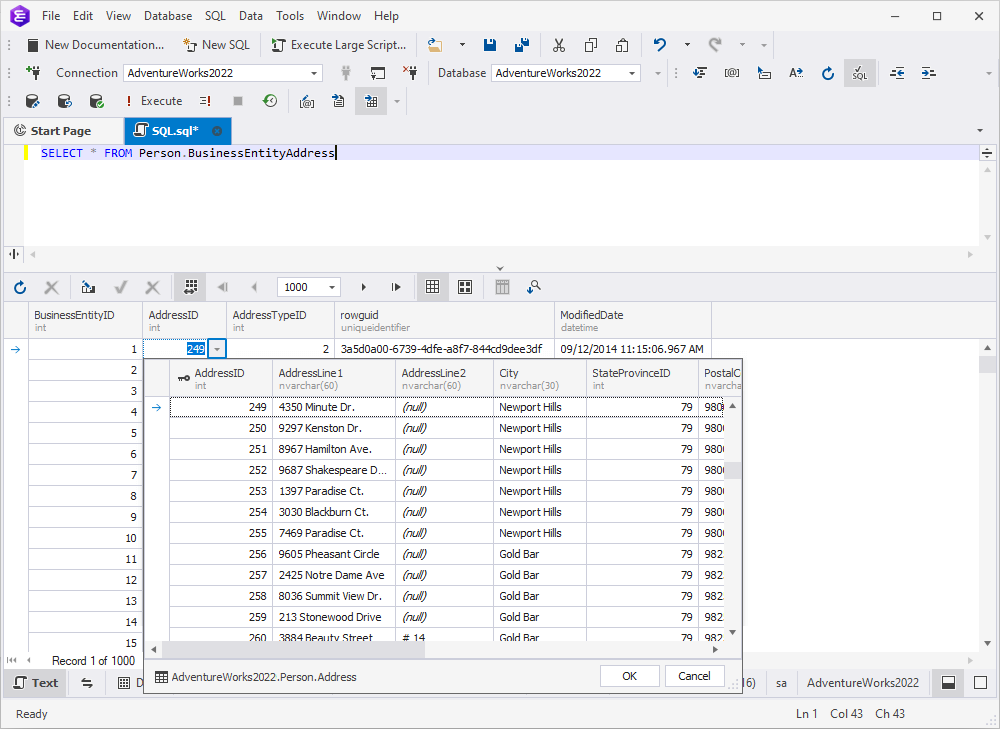
If you are editing data in a table with a foreign key, you can view the data of the related table using the foreign key lookup feature right in Data Editor.
The data of the related table is shown after you click
next to the field you want to edit. The corresponding record in the related table will be highlighted, as shown in the screenshot below.
Select data
To select data, use one of the following ways:
-
Move the mouse pointer across the grid holding the left mouse button.
-
Click the first cell of the required data range, press and hold SHIFT, and then select the last cell. A rectangular range of cells will be selected.
-
Use CTRL+A to select all cells in the grid.
Using the CTRL key can include/exclude cells from selection. Any number of rows may be copied and pasted to another application (for example, a spreadsheet). However, when you paste data in the data grid, only the first row will be pasted.
Copy and paste data
To copy the selected data, right-click it and do the following:
- Select Copy on the shortcut menu or press CTRL+C to copy data.
- Select Copy With Headers on the shortcut menu or press CTRL+SHIFT+C to copy data with headers.
- Select Copy Data As on the shortcut menu to Copy Column Names Only or Copy Column Names and Types.
To paste data, select Paste or Paste As New Records on the shortcut menu or press CTRL+V.
Insert and delete data
You can use the shortcut menu or the corresponding controls under the grid. For example, you can do the following:
- To insert NULL (instead of an empty string), select Set Value To > Null on the shortcut menu. Alternatively, press CTRL+0.
Note
Use the Set Value To menu to quickly set an empty string, zero, or the current date.
-
To add a new record, select Append on the shortcut menu or click + under the grid.
-
To delete a record from the grid, select Delete on the shortcut menu or click - under the grid. Alternatively, press CTRL+DEL.
Note
Some queries return read-only data; for example, queries with aggregate functions (e.g. COUNT, AVG) or data, retrieved from non-updatable views. Such data cannot be edited. It is also impossible to edit the results of multiple SELECT statements.
Row and cell indicators
When working with the grid, you can see special indicators next to the focused cell. These indicators reflect the current editing state.
 The row is focused.
 The row is being edited.
 The row has been edited.
 An invalid value has been entered into a cell. You must either enter a valid value or press ESCAPE to cancel changes.
Copy and paste in spreadsheet-like data editor
When you open the Data Editor in dbForge Documenter, it provides a spreadsheet-like interface where data is organized in rows and columns. The Copy-Paste feature allows you to copy data from other sources, such as text files, Excel tables, or other tables within the app, as well as vice versa: copy data from dbForge Documenter and paste it into other applications.
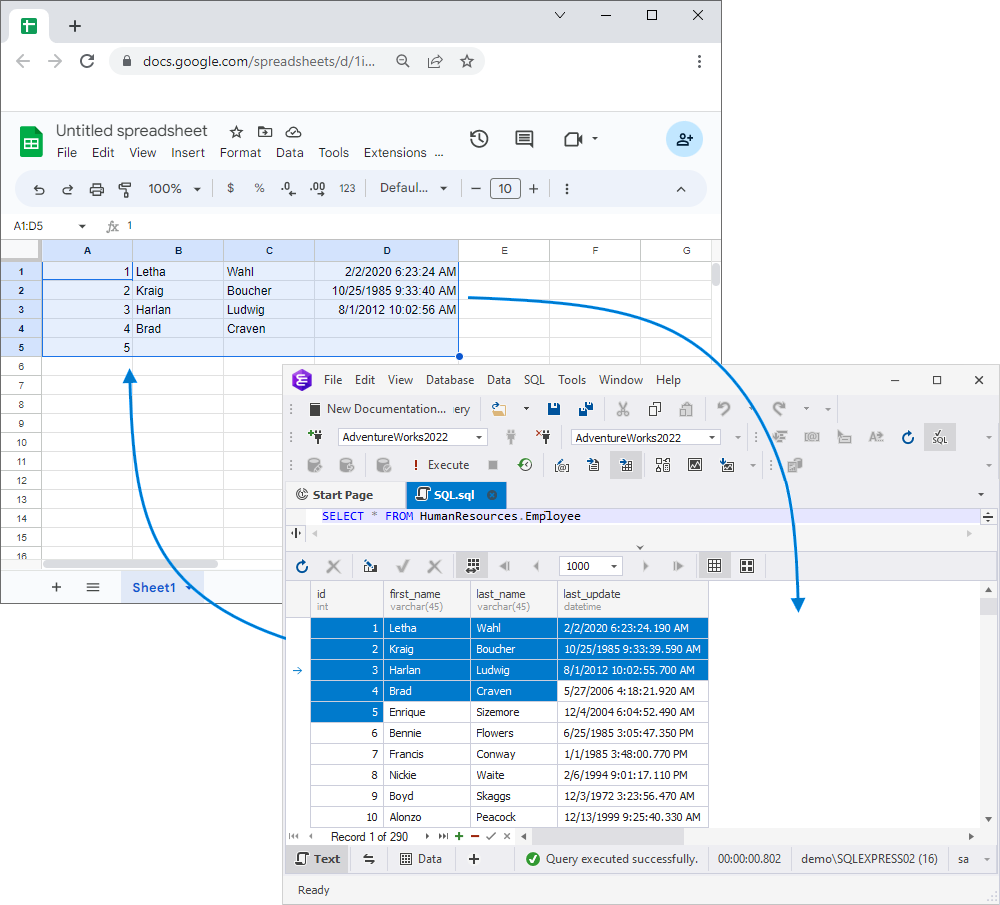
Copying and pasting in dbForge Documenter is similar to the standard process in other spreadsheet applications. You can select cells, rows, or columns containing the necessary data and then copy them to the clipboard by pressing Ctrl+C.
Next, you navigate to the location where you wish to paste the data in dbForge Documenter and perform the paste operation by pressing Ctrl+V.
Note
It is important to note that for this approach to function correctly, the cached update mode must be enabled.