Keep database performance data at your fingertips
With dbForge Monitor, you can easily access and view all your database performance data in one centralized location. The intuitive interface of this SSMS add-in allows you to keep important metrics and information readily available in a single hub right before your eyes: on the Overview tab.
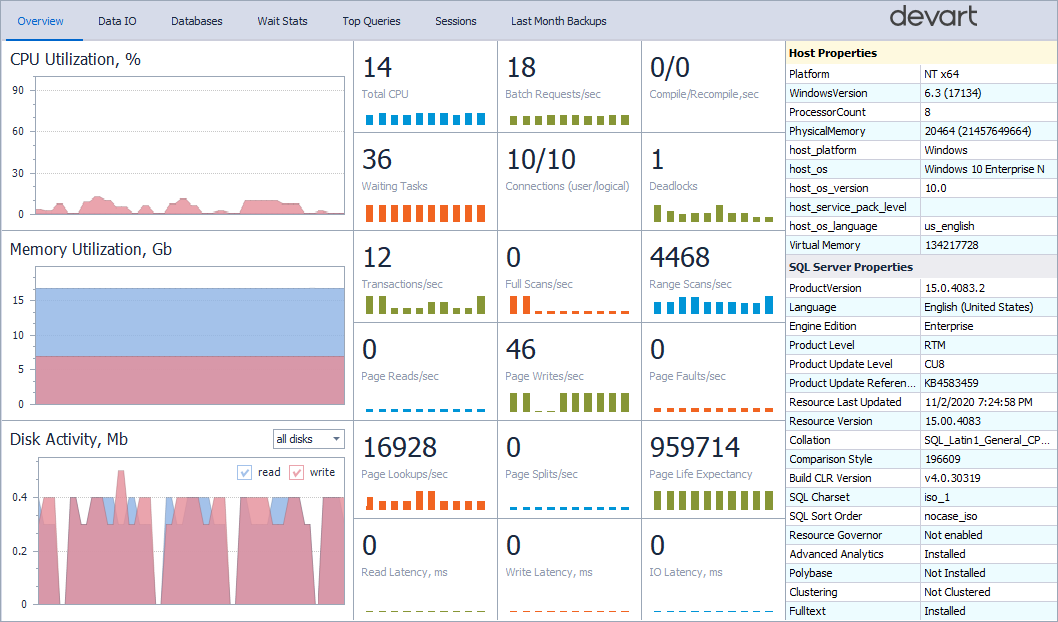
The Overview tab comprises all the vital information regarding the database functioning:
- CPU usage, memory usage, and disk activity.
- Detailed Host and SQL Server Properties.
- Real-time charts and graphs that depict the current state of the monitored instances.
- A high-level summary of the performance metrics.
- A centralized location to view and track performance trends over time, enabling historical analysis and comparison.
The Overview tab serves as a convenient starting point for database administrators and developers to quickly assess the overall performance status of their SQL Server instances.
Note
dbForge SQL Monitor does not log data. It only allows viewing the current state of databases and monitoring SQL Server performance in real-time.