Creating Pivot Table
This topic describes how to create pivot tables and efficiently analyze data using pivot tables.
Pivot Table
Pivot table is a table that allows you to easily rearrange or pivot your data by a simple drag of a mouse until you get the layout best for understanding the data relations and dependencies. You can create pivot tables using Pivot Table view of the SQL document.
Some facts about a pivot table creation:
- You should connect a pivot table to the data you want to display and rearrange in the pivot table. The data source can be a query in the SQL or query document.
- Not all the data source tables are good for converting into a pivot table. The data source should contain a column with duplicated values, which can be grouped, and a column with numeric data, which can be used to calculate grand totals and custom totals.
- You should place data source fields from the Data Source view into pivot table areas to add the data to the pivot table.
Creating Pivot Table
Let’s take the Order Entry (OE) schema to create a pivot table to analyze yearly and monthly profit gross from online and direct orders.
In Database Explorer, right-click the ORDERS table, point to Send To, and then click Pivot Table.
Note
In this eample, only one table was used. If you need to create a pivot table based on several tables, see What is Pivot Table
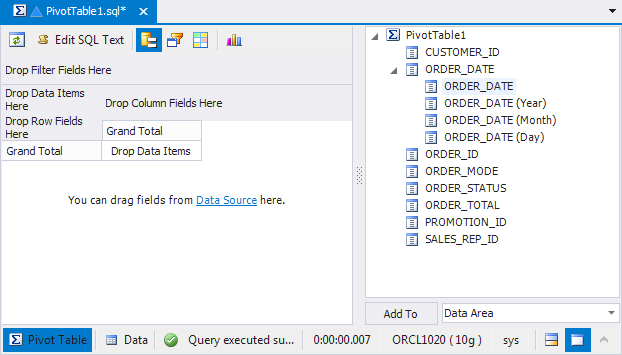
The Pivot Table document with pivot table template, and Data Source view with the table fields (when dealing with pivot tables, data source columns are referred to as fields) open.
Note
Any field with date or time data format is decomposed in the Data Source view to its components.
In this case, the ORDER_DATE field is decomposed into four fields: year, month, day, and master field. The latter allows you to add the three order date sub-fields to a pivot table at once.
Let’s think how to efficiently place the selected fields in the pivot table:
- Since we would like to range orders made online from the ones made directly, we put ORDER_MODE to row field.
- The ORDER_TOTAL field has numeric data, so it is reasonable to place it into data area where grand totals and custom totals can be calculated.
- If date fields are displayed as column fields, i.e., horizontally in the pivot table, we will be able to group gross figures by payment day, month, and year.
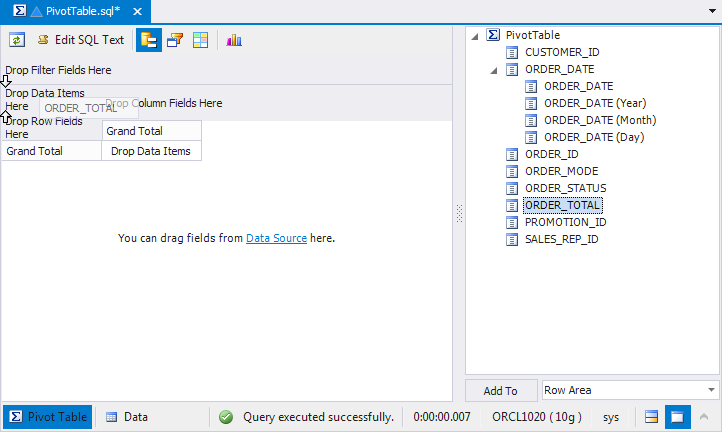
To add fields to the pivot table, drag-and-drop them from the Data Source view to a required pivot table area or highlight a field in the Data Source view, select a required area from the Destination area drop-down list and click the Add To button or just press ENTER.
To add two or more fields to the same pivot table area, add the first field and then drop the second one before or after the first field in the area.
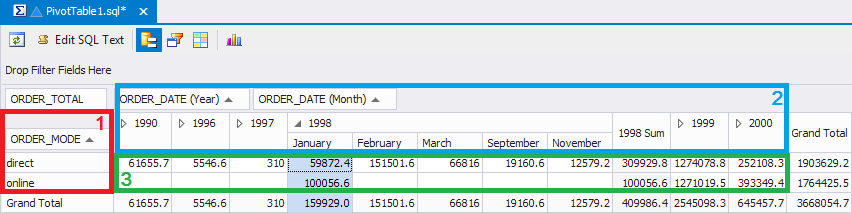
Now our pivot table looks in the following way:
- order mode as row fields (1)
- gross date (Year) and (Month) as column fields (2)
- gross amount as data field (3)
- custom totals and grand totals that are automatically calculated for the added fields
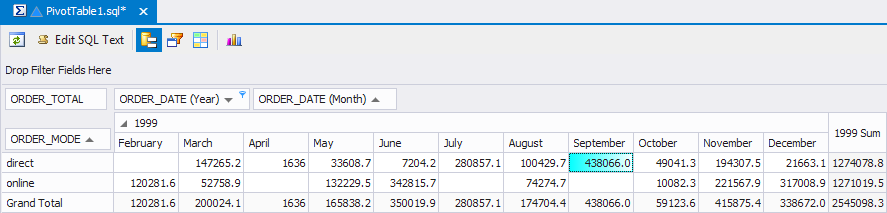
The month details for each year may be hidden by collapsing the category name nodes to define the most profitable year. To sort the values in the fields, click the Sort button. You can also filter data, for example, to display data only for the year 1999, click the Filter icon in the ORDER_DATE (Year) field and clear all values, except the 1999.
If required, you can apply conditional styles to the pivot table to better process the data. For example, you may need to quickly see what months of a year were the most profitable.
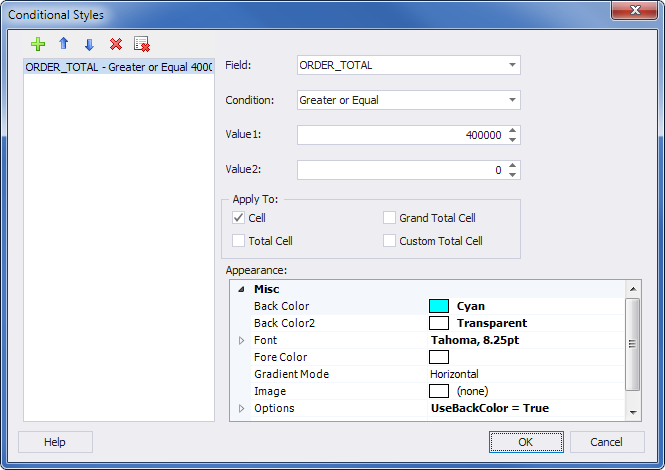
- Click the Conditional Styles button on the Pivot Table toolbar or right-click the pivot table header and select Conditional Styles from the menu. In the opened dialog, click the button to add a new condition.
- Select payment amount in the list of fields, Greater or Equal in the Condition field, enter 0 in the Value1 field. In the Apply to section clear all the check boxes except the Cell check box. In the Appearance section click the BackColor field and select the LightCyan color to highlight the cells.
See the result in the pivot table.