Designer Elements
This topic gives a brief overview of the main report designer elements.
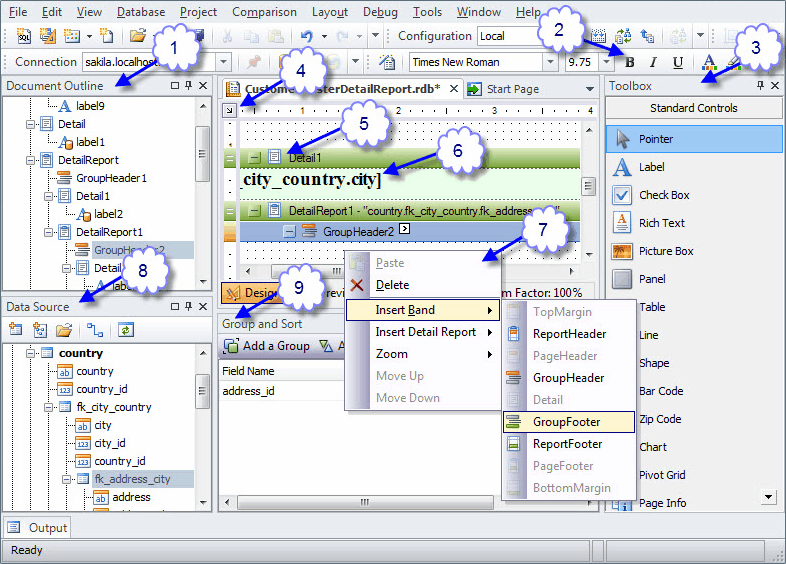
The following image shows how typical Report Designer and its elements look like:
Note
Actual document look may slightly vary from the above image, depending on the product you use.
The table below gives a brief description of each element marked on the image:
| ID | Name | Description |
|---|---|---|
| 1 | Document Outline Window | Provides quick and easy navigation through the report elements. |
| 2 | Devart-Data Report Toolbar | Contains buttons to change font properties of the selected control, buttons to access the Toolbox, Data Source, and Group and Sort windows, and also provides capability to zoom in or out the Report Designer surface. |
| 3 | Toolbox Window | Contains controls available in dbForge Fusion for MySQL data reports. |
| 4 | Smart Tag | With smart tags, report controls and bands are enabled to display context-sensitive information and commands. |
| 5 | Band Strips | A strip with band name, band icon, and the Expand/Collapse button displayed on the top of every report band. Strips are not taken in account when generating a report document. |
| 6 | In-Place Editor | To invoke this editor, double-click any text-aware control in Designer. To adjust font and color options use Devart - Data Report Toolbar (1). |
| 7 | Shortcut Menu | Right-click any element when designing a report to invoke shortcut menu. It provides access to the most popular options depending on the context. |
| 8 | Data Source Window | Displays the schema of the data source currently bound to a report. |
| 9 | Group and Sort Window | Serves for applying grouping and sorting to a report. |