dotConnect for MongoDB Documentation
dbMonitor is a tool for monitoring and analyzing database operations in applications that use dotConnect for MongoDB. It provides a visual interface for tracing database events in desktop applications, ASP.NET applications, and Windows services.
dbMonitor tracks database events for individual components, including opening and closing connections, connection pooling, command preparation, and command execution. For command events, it displays the command text:
maxTimeMS field.
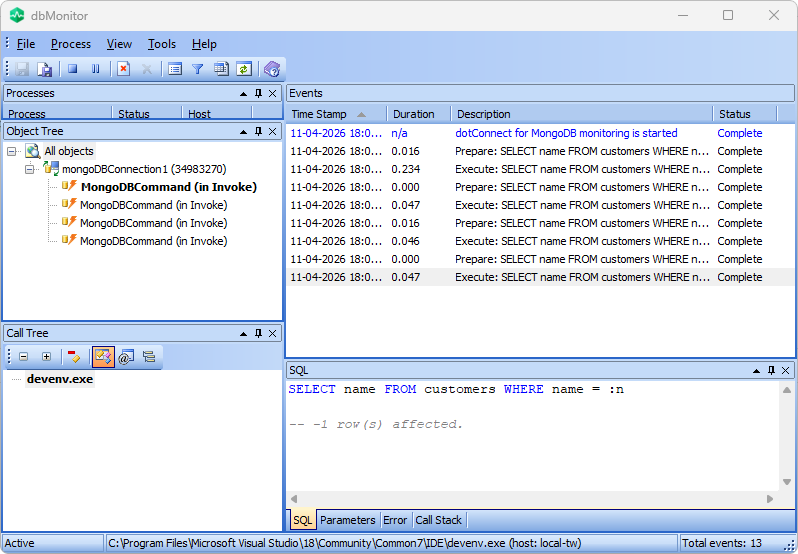
For example, an application that executes a parameterized SQL query followed by a native MongoDB count command generates the following events:
dbMonitor provides the following features for viewing, filtering, and analyzing database activity.
The Events grid displays traced database events, including their descriptions, timestamps, durations, and statuses. You can sort events by clicking a column header. When you select an event, the SQL, Parameters, Error, and Call Stack windows display additional information about it.
The event details area contains four windows:
Select an event in the Events grid to view its details, and switch between the windows to inspect the available information. To open a specific window, select the corresponding command from the View menu.
The Processes window lists monitored processes and their current statuses. Select a process to display its events in the Events grid. When an application closes, its process is marked as Terminated. Its event log remains available for viewing or saving to a file.
To remove a terminated process, use one of the following methods:
The Object Tree window, located below the Processes window, displays monitored objects in a hierarchy:
Select a node to display events associated with that object and its descendants. This lets you filter events by connection, object, or connection pool.
The Call Tree window displays the combined call stacks of database events for the selected process. You can use this window to filter events by the functions that initiated them. Select a function in the call tree to display only events initiated by that function or its descendants.
dbMonitor supports remote monitoring, letting you trace database operations in applications running on another computer. For the configuration steps, see How to Monitor an Application Remotely.
dbMonitor supports Unicode, letting you monitor applications that work with international character sets.
You can switch between monitored processes, explore object hierarchies, and inspect database events during application execution. dbMonitor is designed to minimize its impact on application performance. Monitoring is also available at design time.
To enable monitoring in an application that uses dotConnect for MongoDB:
true.To trace an application running on another computer:
You can reduce monitoring overhead by disabling call stack collection and filtering the events sent to dbMonitor.
false.