Grouping Data in Grid
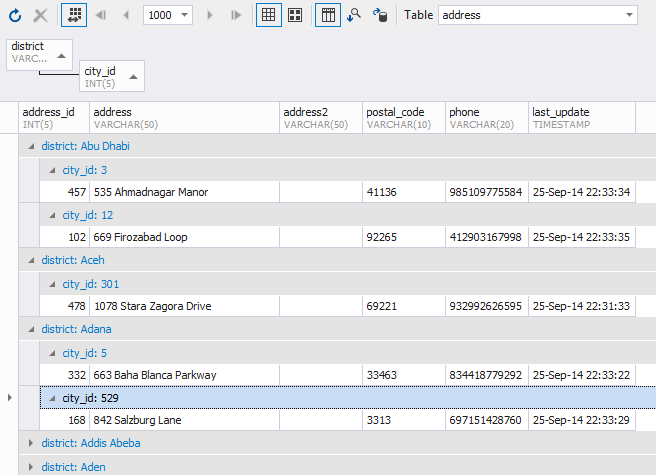
To group data by column, click  Show Group by Box on the document toolbar. The Group by Box pane will appear above the grid. Drag a column header you want the data to be grouped by to the pane.
Alternatively, right-click the required column header and click Group By This Column on the shortcut menu. The data is automatically displayed in groups marked with collapsed nodes. The column header is moved to the Group By Box pane.
Note
Actual document look may slightly vary from the above image, depending on the product you use.
Group By Box is the area above the data grid where you can see the grouping order and perform further grouping-related operations. Drag a column header to Group By Box to group the data by that column. You can group the data by multiple columns. In this case the grid will display a tree of nested groups that you can expand by clicking + buttons. To collapse the groups, click - buttons.
To expand or collapse all groups at once, right-click the Group By Box pane, and then click Full Expand or Full Collapse on the shortcut menu.
To cancel grouping by column, drag-and-drop the column header from the Group By Box pane to the grid or right-click the column header, and then click Ungroup on the shortcut menu.
To remove all groupings, right-click Group By Box, and then click Clear Grouping on the shortcut menu.